
Approach and Landing Performance Part 2: Approach Speeds, Cold Weather Corrections, Sources of Data
Target: Approach speed calculation
The speed at which aircraft fly on approach depends on a variety of factors including:
- Aircraft weight
- Flap setting
- Wind direction/speed
Final approach speed is commonly known as Vref (or Vapp). This is the speed at which the aircraft should be flown once the final stage of landing flap has been selected. Vref is often calculated by the pilots using the FMC/FMS hence no Electronic Flight Bag (EFB) function is required. However, on many aircraft the approach speed is calculated by an EFB. When the approach is calculated by an EFB there are two methods for displaying and targeting that speed on the Airspeed Indicator (ASI) during final approach:
- Digital ASI: Enter Vref into the FMS/FMC, it will then be displayed on the speed tape
- Analogue ASI: Use airspeed bugs on the ASI to target. These slide on a bezel and are set by the pilots
When PTP modified an approach performance application, one of the items we were able to manipulate was Vref. In the example below the correct Flap 25 Vref is 151 knots, as shown at the top of the FMC. When we inserted a speed of 137 knots there was no warning or message to say an incorrect speed had been entered (some 14 knots slower than the correct speed).
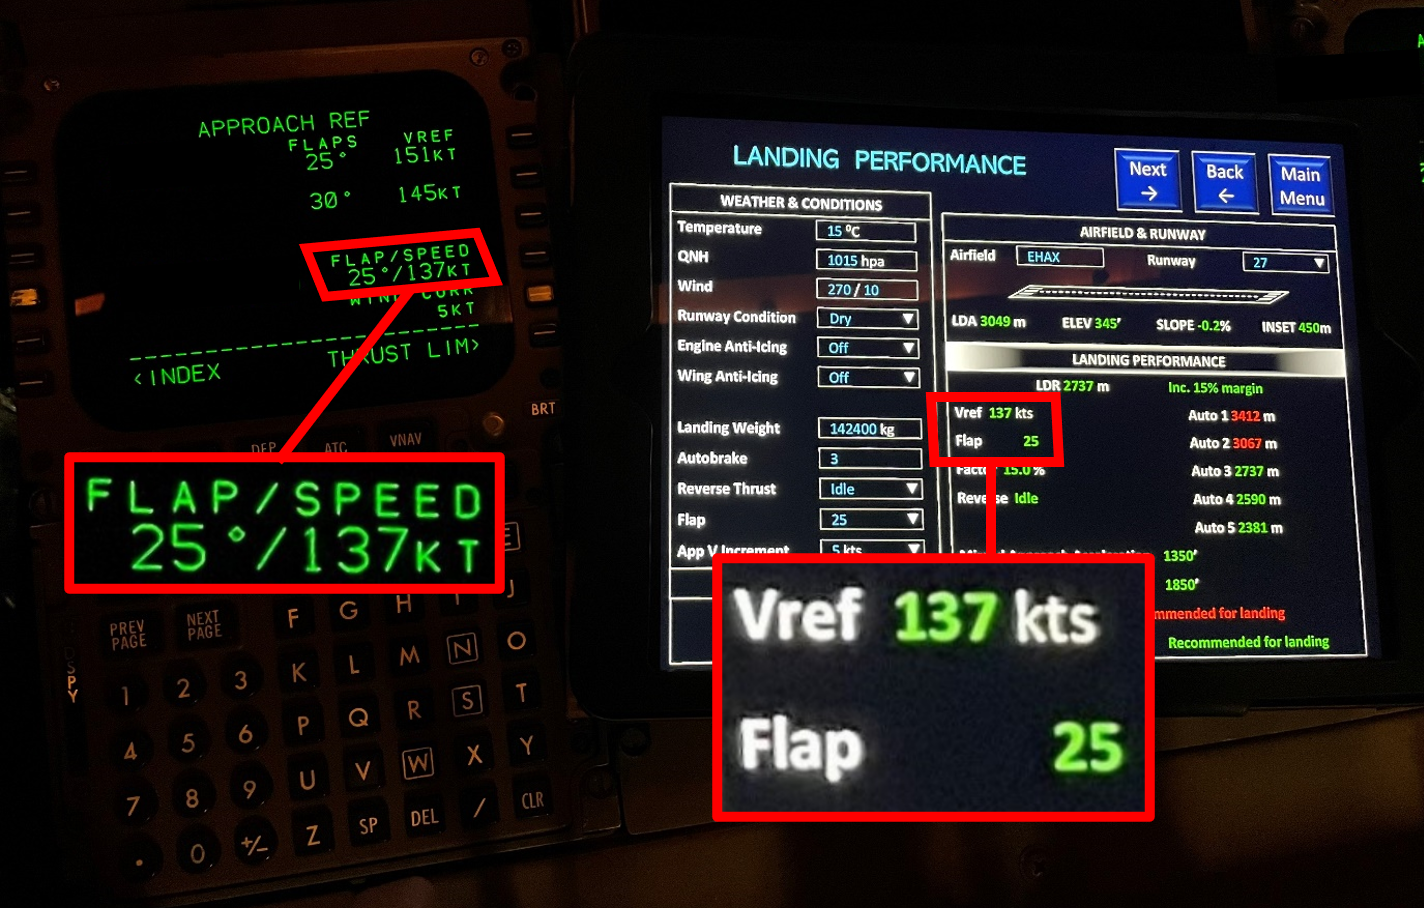
Vref entry into FMS for a digital ASI
It should be emphasised that many aircraft will have other systems which warn pilots of flying too slowly, including warning flags on instruments (or aural alerts), and error messages when too slow a speed is entered into the FMS for approach. However, not all aircraft have these preventative measures in place, so when an EFB is used to calculate the Vref it is critical that the calculation is performed correctly.
Stall and loss of control risk
An aircraft flying more slowly than the correct Vref would be at risk of stalling. As was mentioned in the Take-off Performance blog post, a stall at low level is extremely dangerous. If one were to occur, it is likely in many scenarios that there would be no opportunity to recover the aircraft into safe flight. It can take thousands (and in extremes tens of thousands) of feet to recover from an established stall.
In the following video, during testing of a commercial aircraft a stall was carried out at high altitude. One wing stalls prior to the other wing, resulting in the aircraft rolling into an inverted position. It should be noted that a stall like this (rolling inverted) is unlikely on many commercial aircraft which when placed into a stall will remain wings level but with an excessive descent rate (similar to Air France 447 which stalled mid-Atlantic in 2009, sadly resulting in the loss of all on those board). However, in all cases it is certain that height loss will occur as a result of a stall, whether the aircraft remains wings level or not.
Video:
Top right of the video is a visualisation of what occurred.
Having used the EFB to calculate the Vref, the pilots will either bug the Airspeed Indicator (ASI) to fly on final approach or enter the final approach speed into the FMS. The Vref applies to the flap settings the pilots have decided to use for landing. Using an approach speed for a greater flap setting (e.g. using Flap 30 approach speed when using Flap 20 for landing) would result in the aircraft flying too slowly, hence it is important the application performs this calculation accurately. The proximity to the stall in the event of this error would depend on the aircraft type in question.
In the event of a manipulated Vref, if that Vref was higher than the stall speed it could still cause significant damage to the airframe and risk of injury to passengers. Pilots land aircraft visually, and they do so having flown the approach at the correct speed. The judgement and timing of the flare is visual and in the event of the aircraft flying at a slower Vref than the correct approach speed then it is likely it would result in a heavy landing. There are many instances of aircraft receiving significant damage due to the result of heavy landings (see accidents/incidents below), many of which have been due to the aircraft flying at a slower than necessary speed.
Equally, when flying at a faster Vref due to an unserviceability of a component onboard (for example a trailing edge flap being stuck in the “up” position), a correction will be made to account for this. In some cases over 25kts can be added to the approach speed. Suppression or modification of the Vref correction to be made in the event of an unserviceability would significantly increase the chances of a heavy landing (and possibly a stall too).
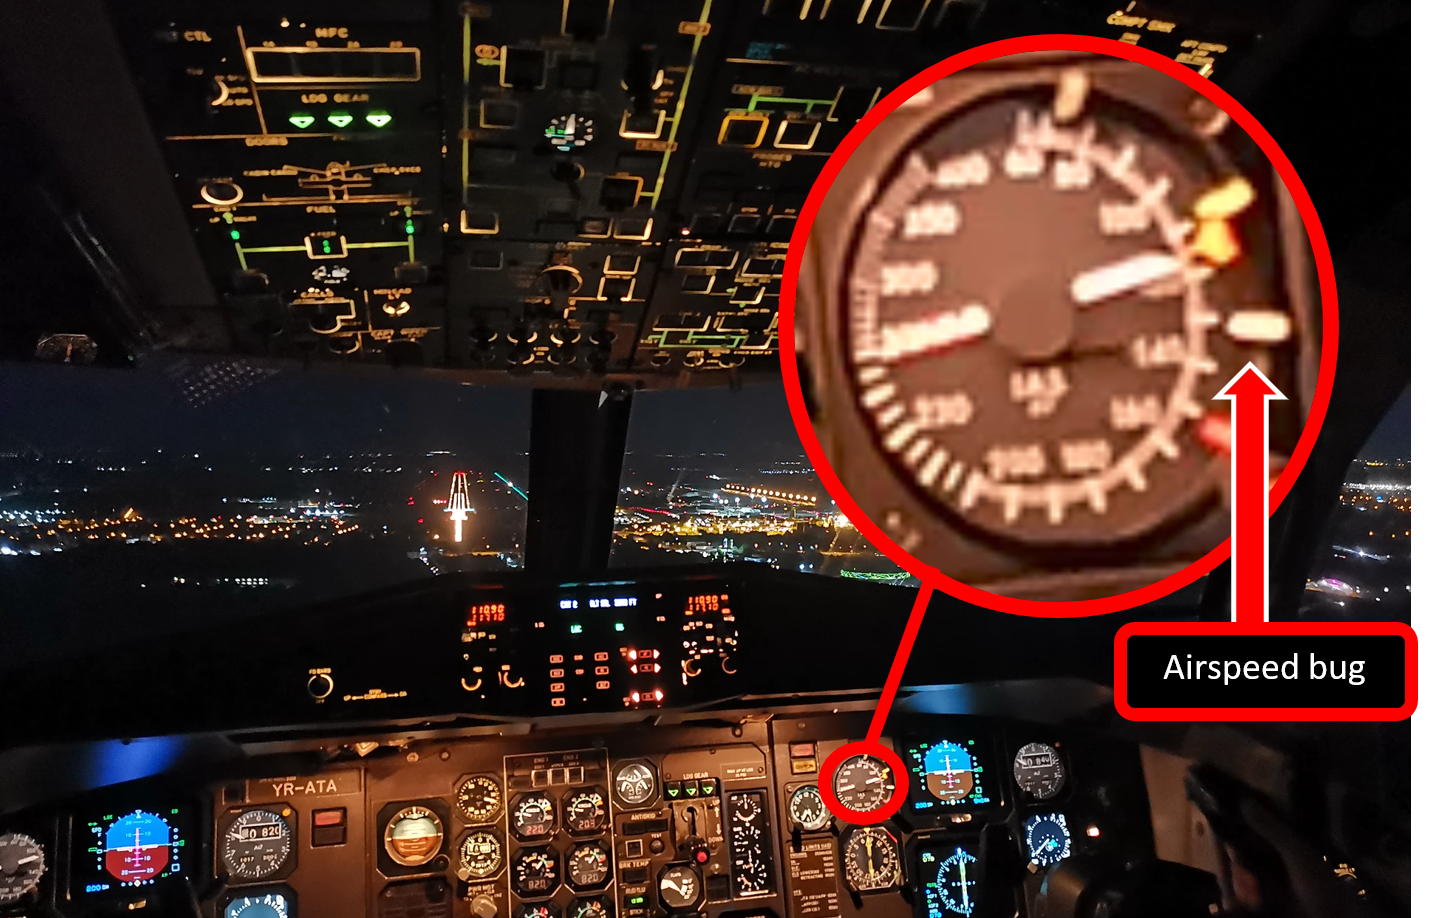
Analogue ASI with bugged airspeeds (markers on right hand side of instrument)
The approach speed is also modified with regards to the wind expected on landing. A headwind provides airflow over the wings, so if the wind were to reduce (even for a short duration) then the airspeed of the aircraft will reduce. For this reason, approach speeds are increased when flying into headwinds. The amount and criteria used are aircraft/airline specific, however they almost all share the commonality of increasing the approach speed in a headwind.
To calculate the adjusted wind Vref, pilots that use EFB’s for landing performance calculations enter the wind direction and speed into the application which in turn produces a new Vref. Suppression (or manipulation) of the wind effect could result in the pilots targeting an airspeed that is not appropriate for the wind conditions present.
Incidents/accidents:
Jazz Aviation DHC-8 at YTZ in 2017. Wind variations caused the aircraft to be in a slow position during the flare, resulting in a heavy landing. A gust of wind which reduced the airspeed occurred below 100ft causing buckling of the aircraft skin as well as substantial damage to the aircraft.
Report: https://reports.aviation-safety.net/2017/20171109-0_DH8D_C-GYJZ.pdf
Trigana Air 737 at WMX in 2016. The cause of the accident was pilot error however this demonstrates the risk of a heavy landing. Both main landing gear collapsed with the left one becoming completely detached. The aircraft was subsequently written off.
Report: http://knkt.dephub.go.id/knkt/ntsc_aviation/baru/2016%20-%20027%20-%20PK-YSY%20Final%20Report.pdf
Nordwind A321 at AYT in 2020. On approach the airspeed decreased below the approach speed (by 13kts). The aircraft landed heavily at which point the pilots performed a go-around. Multiple systems failed, the landing gear was stuck down, smoke entered the cockpit and a mayday was declared. Subsequently a dual hydraulic failure occurred.
Report: https://aviation-safety.net/database/record.php?id=20200110-0
Target: Temperature / cold weather correction
Modern commercial aircraft generally have two types of altimeter – barometric pressure altimeters and radio altimeters. For navigation purposes the barometric (baro) altimeter is used. In reality baro altimeters read the air pressure not the altitude. If the air temperature is lower than International Standard Atmosphere (ISA), which is 15⁰ C at Mean Sea Level (MSL), then aircraft baro altimeters overread the altitude. This is because they are calibrated to ISA.
To improve safety, over the previous years the advent of cold weather applications and temperature error calculators has ensured that a more robust method for calculating aircraft height/altitude is used. These applications are generally either contained within a generic aircraft/airline performance application or are a standalone application which the airline has obtained approval from the Regulator to use. A further safety enhancement is the advent of temperature compensation within the FMS design, however this is only available on the very newest commercial aircraft designs – most commercial aircraft do not have this feature.
The effect of cold temperatures on altimeter readings can be significant. On a conventional ILS approach the risk is mostly mitigated because the aircraft/pilots fly the approach based on radio signals which are unaffected by cold temperature. However, there is still a risk of CFIT as the minima (height at which pilots must either be visual with the runway or must go around) should be corrected as this is based on pressure altitude. If the minima is left uncorrected (or the correction is a miscalculation) then the aircraft is at risk of simply flying into the ground as the pilots could descend below the actual minima without realising.
Greater risk is prevalent on Non-Precision approaches (VOR/NDB/LOC and the more modern GPS based PBN/RNP/RNAV). With GPS based approaches there is more of a reliance on the aircraft to “fly” the approach rather than the pilots continuously modifying the approach descent rate. Whilst this should not encourage a “sit back and watch” attitude, human factors dictate it does to an extent. Pilots are required to be vigilant at all times, however the design and nature of these approaches can make pilots become overly casual to the risks of flying a GPS based approach.
Airport approach charts have a temperature displayed on them which defines the minimum temperature at which the displayed altitudes will be safe with no correction applied. If the airport temperature drops below the defined minimum temperature, procedures are employed to prevent the aircraft from descending below the correct vertical profile. This depends on both state and airline specific policy. Previously, and still the case in some less technologically advanced airlines, pilots would either do “a bit of guesswork” (roughly 4 feet per degree Celsius of difference from standard temperature for every 1,000 feet above the reporting altitude), or would consult a table beforehand and modify any altitudes to be used on the approach:
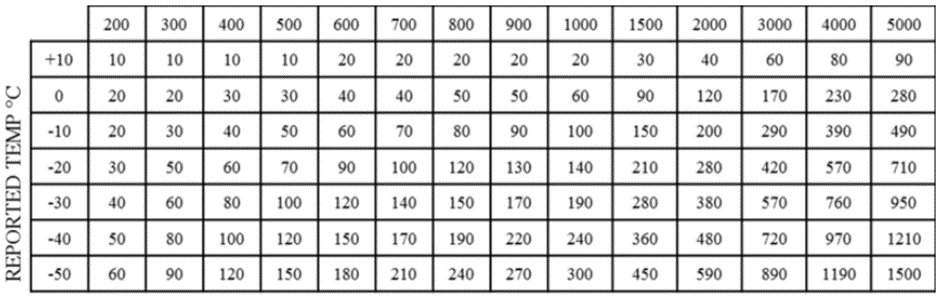
ICAO Cold Temperature Error Table
Depending on the extent of the temperature error, pilots must apply a correction to either the minima (MDA/DA) or all altitudes on the approach in order to have safe clearance above any obstacles/terrain. This also affects how the approach will be flown. In very cold temperatures (generally below -25⁰C) the approach must be flown without the use of VNAV/DES. When VNAV/DES is in use, the aircraft will fly the vertical profile based on the FMC coding. When it is too cold to use VNAV the pilots fly the vertical section of the approach using either VS or FPA/FPV. In both cases, the rate of descent is entirely controlled by the pilot.
On all approaches, pilots continually monitor the aircraft altitude and assess whether their present profile is safe. A comparison is made between the altimeter reading and the specified altitude the aircraft should be at when at that stage of the approach. This comparison is made using Distance Measuring Equipment (DME) which can be the distance from a particular beacon or alternatively the distance to a waypoint in the FMS.
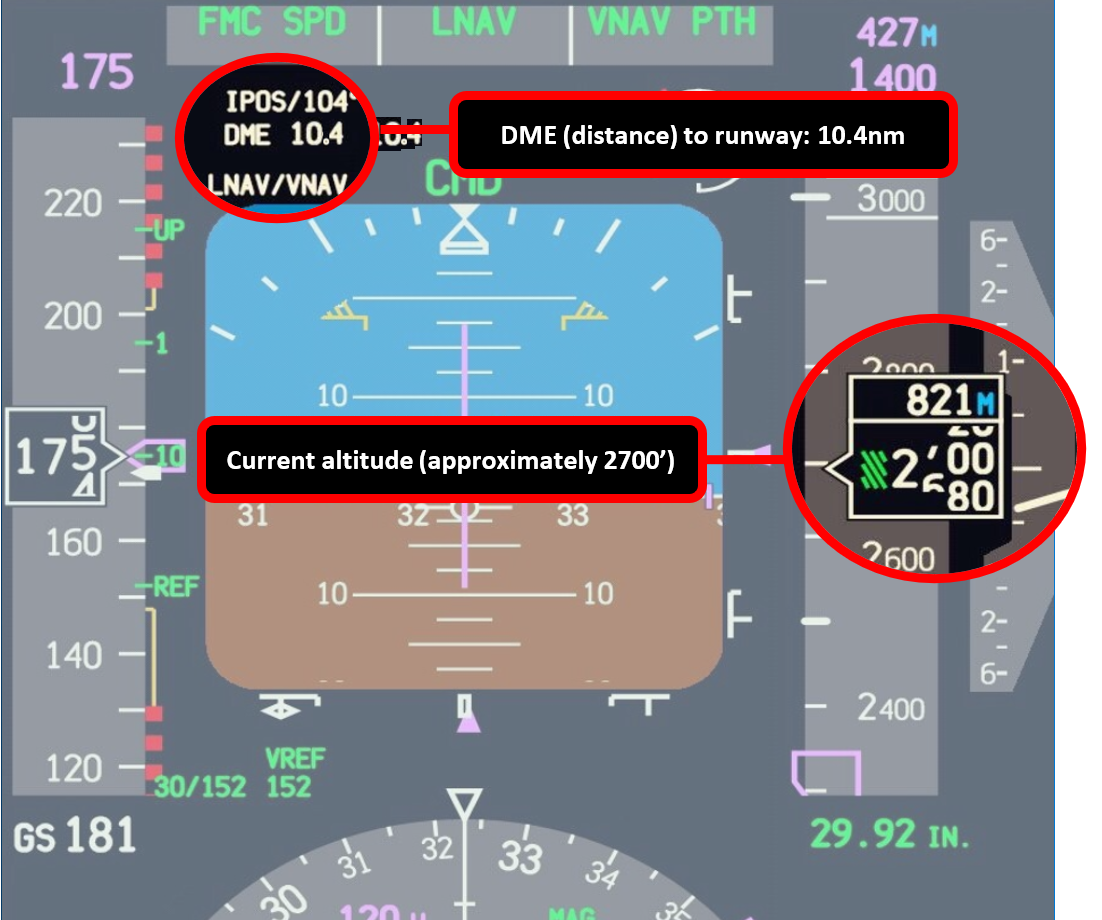
Primary Flying Display showing current altitude and distance to runway
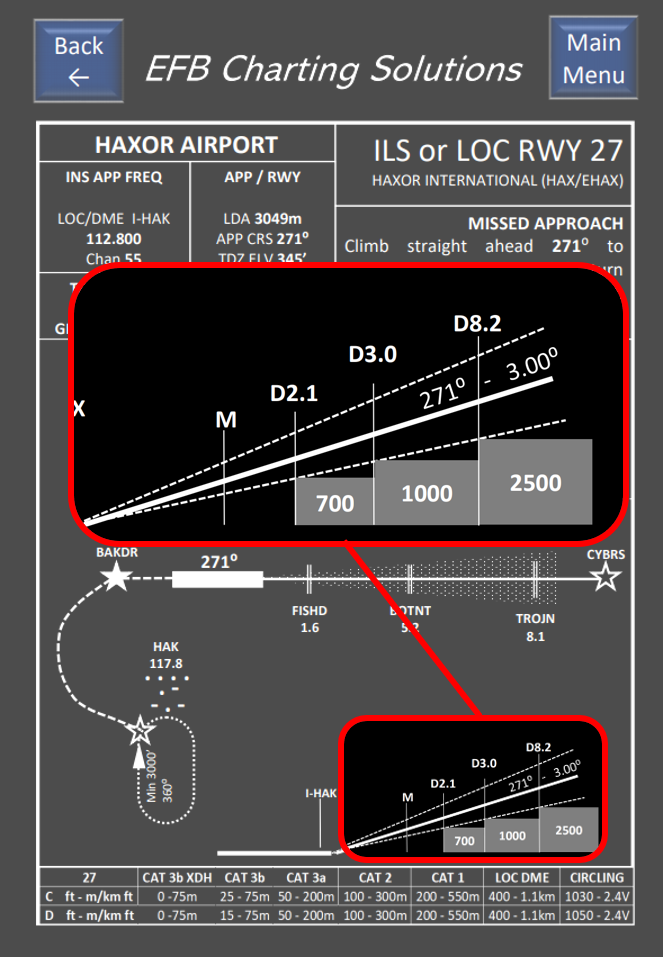
DME and altitude comparison on chart: 2.1nm = min 700′, 3.0nm = min 1000’…
CFIT (Controlled Flight Into Terrain)
EFBs generally provide an application to compute altitude corrections during cold weather. They require the following data: Airfield OAT, airfield elevation, MDA/DA or altitude at which to apply the correction to. If the application were tampered with, the output could be modified to produce a smaller/incorrect correction resulting in the aircraft flying at a lower altitude to that which was intended. Whilst the proportional error is greater at higher altitudes, the tolerance for errors reduces at lower altitudes as aircraft are in closer proximity to the terrain – hence an error of say 40 feet at low level is very significant.
In the incidents/accidents list the Air Canada A320 accident at Halifax in 2015 demonstrates this risk, the following are extracts from the report:
- “…SOP and practice when flying in flight path angle guidance mode was that, once the aircraft was past the final approach fix, the flight crews were not required to monitor the aircraft’s altitude and distance from the threshold or to make any adjustments to the flight path angle.”
- “As per Air Canada’s practice, once the flight path angle was selected and the aircraft began to descend, the flight crew did not monitor the altitude and distance from the threshold, nor did they make any adjustments to the flight path angle.”
- “The flight crew did not notice that the aircraft had drifted below and diverged from the planned vertical descent angle flight profile…”
In the Air Canada accident, the pilots HAD corrected for cold temperature error. However, they started their final descent approximately 5 seconds too early and did not correct the descent angle after the Final Approach Fix. In this accident, inadequate procedures for non-precision approaches were a primary cause. It does however demonstrate the risks of being just slightly low during the approach phase. The aircraft landed short of the runway by just 0.3nm (approximately 8 seconds flying time or roughly 90 feet lower than the correct profile) and was subsequently written off. It was fortunate that there were no fatalities in this accident.
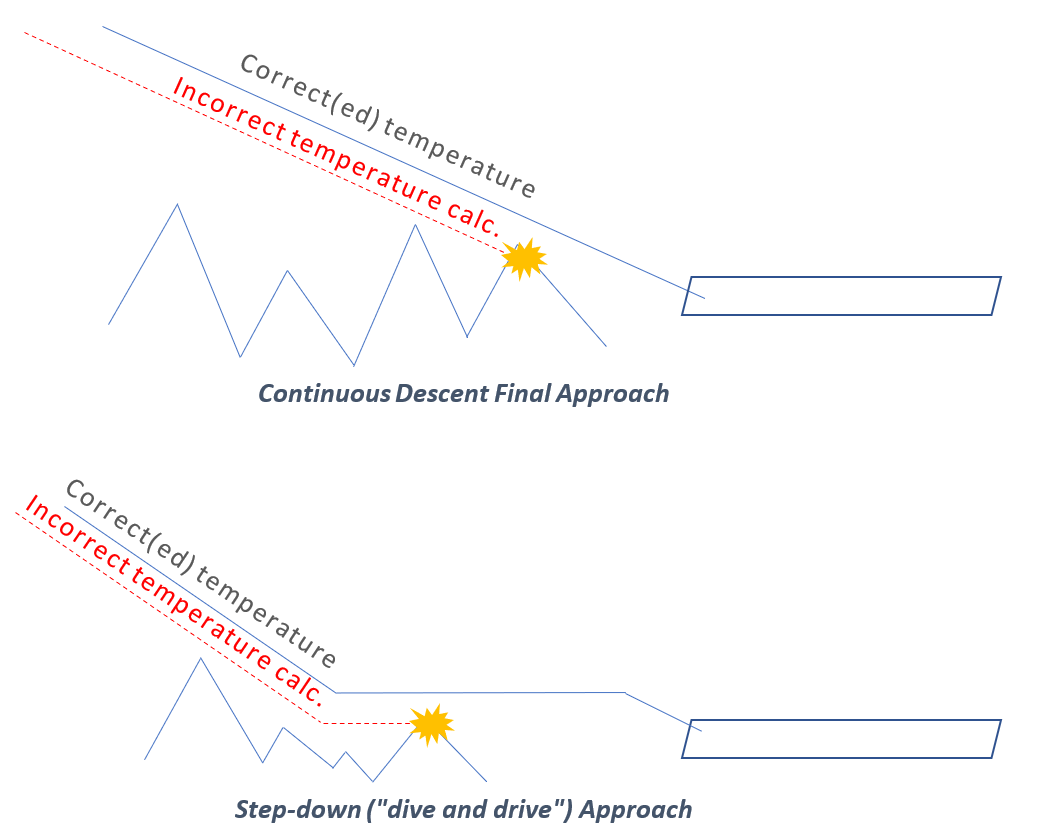
Being low on any type of approach is a dangerous place to be. The threat of being low on a Continuous Descent Final Approach (CDFA, a more common approach path method in the modern age) is significant. This threat is even more pronounced on an approach which does not employ the CDFA technique (a.k.a a “step down” or ”dive and drive” approach). With these approaches, the pilots descend the aircraft to an altitude below a traditional approach glidepath and level off. Having levelled off the pilots fly towards the runway in level flight and on reaching the Missed Approach Point (MAP) either continue to land (if visual) or go-around. The result of these approaches is that the aircraft is lower than it needs to be, but if flown correctly is still a safe method for conducting an approach. Many airlines now forbid step down approaches due to the risks involved if flown incorrectly, although it is still permitted by many companies.
Any temperature error on a step down approach which has not been correctly addressed could lead to the aircraft flying below the minimum altitude until reaching the MAP. The threat of being low on a CDFA however is also significant.
If a Cold Weather Application/Calculator were tampered with and produced an incorrect/insufficient altitude correction then the resulting risk is very significant. Some may argue that in this instance ground proximity warning systems would alert pilots that they are too low. This is not the case, as the Air Canada accident in Halifax shows. Having flown below the correct profile for 5nm with no warnings they were too low. Whilst there are systems fitted to commercial aircraft which generate warnings when they fly close to terrain, in this scenario it is likely no warning would be generated.
Wouldn’t Air Traffic Control (ATC) say anything if the aircraft was low? The answer is no, either because they are using primary radar (which has no altitude information and only displays lateral position) or they are using secondary radar which does display altitude information, but this is based on the aircraft pressure altimeter reading – i.e. their altitude reading is also uncorrected for cold weather temperature errors. Even if ATC had more precise altitude information, the information displayed would still be incorrect due to the lack of temperature error correction.
Ground proximity systems and their Achilles heel
There are two ground proximity warning systems fitted to commercial aircraft: Ground Proximity Warning System (GPWS) and Enhanced Ground Proximity Warning System (EGPWS). It should be noted that neither GPWS nor EGPWS are likely to generate a warning in the uncorrected altitude cold weather warning scenario. Below is a brief description of how they work and why they would be silent in the cold weather scenario. Suffice to say, they are inhibited when in close proximity to an airport or when the landing gear/flaps are deployed as they assume the aircraft is trying to land. Therefore, warnings are silenced to prevent pilots being distracted during routine approaches.
Human factors should also be given consideration. Hearing is often the first sense lost during overload. This is why in many aircraft accidents pilots have not responded to “PULL UP” warnings – quite simply their brains are often not interpreting the information as they are experiencing overload (commonly due to a loss of situational awareness). Whilst a warning would not be generated in this scenario, even if it were then it cannot be guaranteed that the responses would be correct (as history has shown us).
Ground Proximity Warning System (GPWS)
GPWS uses the aircraft’s radio altimeter. The radio altimeter determines the height of the aircraft over terrain directly underneath the aircraft (it cannot “look ahead”, only vertically below). As a result the radio altimeter is unaffected by cold weather as it is not using barometric pressure to assess aircraft altitude but instead radio beams directed at the terrain beneath.
GPWS assesses the rate of closure towards terrain using the radio altimeter and generates a warning if the rate of closure is deemed excessive. However, in order for the aircraft to land, “PULL UP” warnings are inhibited if the aircraft has it’s landing gear/flaps deployed. Given the cold weather scenario, the aircraft would be in the landing configuration and therefore GPWS terrain warnings would not occur.
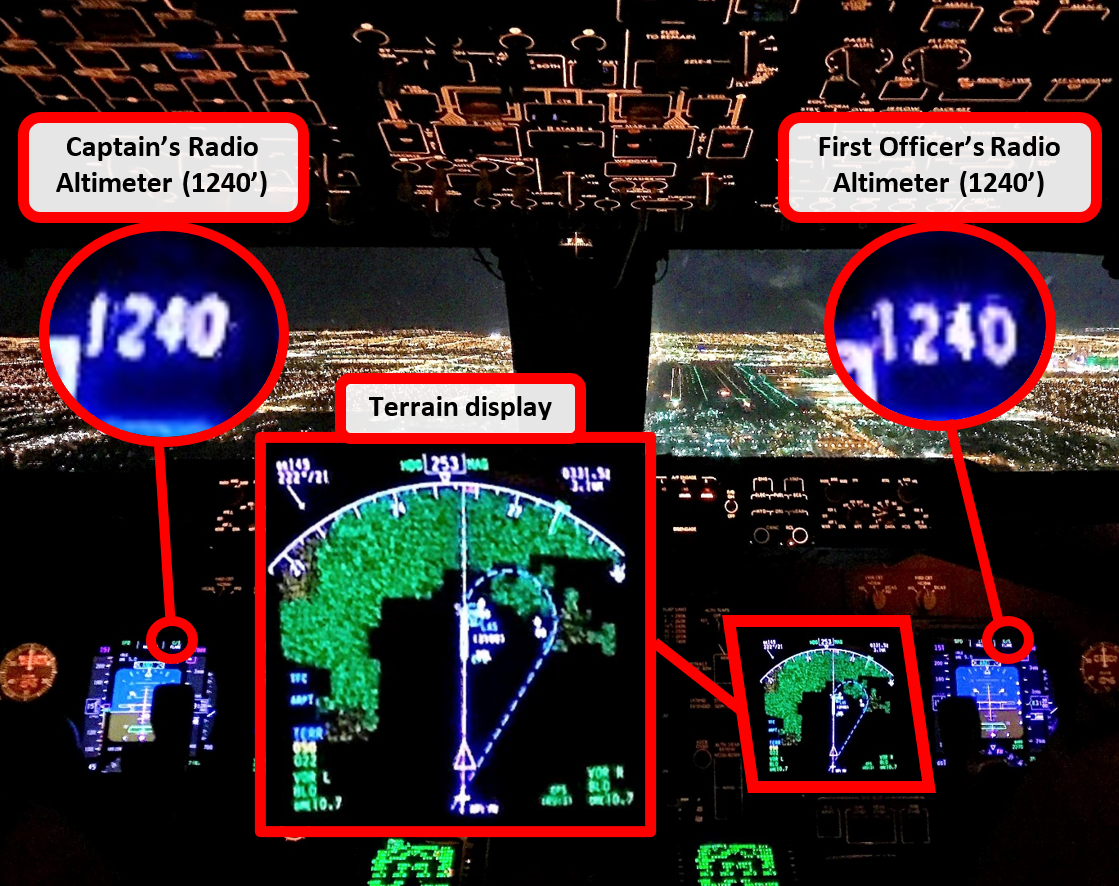
Radio Altimeters and Terrain Display (EGPWS function)
Enhanced Ground Proximity Warning System (EGPWS)
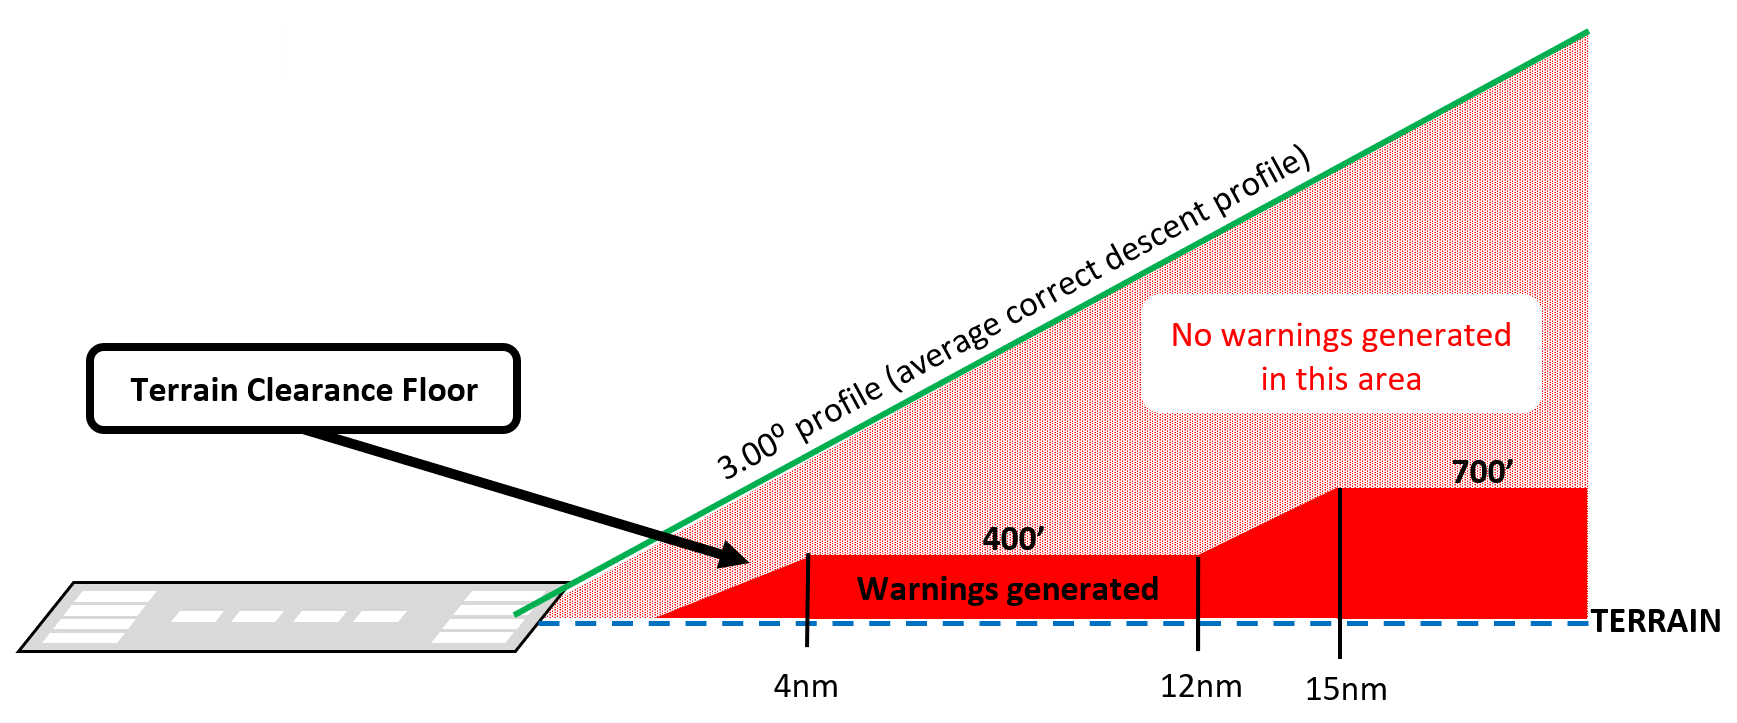
There are several variations of EGPWS, however they all have one similar issue; when in close proximity to an airfield the warnings are silenced automatically as the system assumes the aircraft is landing, hence proximity to terrain is expected. The following shows the protection area (known as the “terrain clearance floor”). Descent below this will generate a warning. As can be seen, if the clearance floor has been reduced due to the aircraft being close to an airfield (within 15nm in most cases), then it becomes much more difficult to generate a warning even if below the correct profile.
Additionally, most EGPWS systems purely use a terrain database. Man-made obstacles (buildings/large antenna’s etc.) are not stored and do not appear on terrain displays. Some of the newer aircraft types do include obstacles in their databases, but the vast majority of presently flown commercial aircraft do not.
Incidents/accidents:
Air Canada A320 at YHZ in 2015, pilots flew a non-precision (LOC) approach using Flight Path Angle. On reaching the FAF, no more height checks were completed resulting in the aircraft crashing short of the runway (CFIT).
Report: https://www.bst-tsb.gc.ca/eng/rapports-reports/aviation/2015/A15H0002/A15H0002.pdf
UPS A300 at BHM in 2013, having misconfigured the FMS the pilots flew a step down approach expecting to be visual at 1000’. A loss of crew situational awareness led to the aircraft crashing short of the runway (CFIT).
Report: https://www.ntsb.gov/investigations/AccidentReports/Reports/AAR1402.pdf
Video:
Tupolev 154 at LNX in 2010, aircraft crashed short of the runway on a non-precision approach. Many high-ranking Polish officials were on board, including the Polish President. Terrain warnings occurred incorrectly as the airport was not in the database, consequently the warnings were silenced by changing the Captain’s altimeter setting.
Report: https://en.wikipedia.org/wiki/Smolensk_air_disaster#Purpose_of_the_flight
Sources of data for Approach and Landing Performance
Loadsheet
Source: Originates from company department which controls aircraft loading. The loadsheet will often be created on an application and then either sent to the EFB or alternatively printed by the dispatcher and handed to the pilots prior to departure.
Data used for approach/landing: Zero Fuel Weight (input prior to departure but affects landing weight in FMS)
Weather and Airfield Information
Source: ATIS and/or METAR (weather reports), obtained commonly via ACARS or via VHF radio.
Data used for approach/landing: All airfield and weather information. Approach and landing runway(s) in use, wind direction and speed/gust, OAT (air temperature), QNH (pressure setting), visibility or RVR (runway visual range), runway specific data e.g. runway surface condition (contamination), RVR/visibility, additional information e.g. “LAHSO in use” or “runway reported as wet”.
FMS/FMC
Source: FMS database
Data used for approach/landing: Landing weight, approach speed (in some aircraft)
Charts
Source: From the EFB charting app (or from paper charts if EFB charts not used)
Data used for approach/landing: Approach and landing planning/briefing, runway length and width, runway slope, runway groove status, planned taxiways to vacate runway, LAHSO information, airport approach/landing operations information, threat assessment of approach and landing/taxi to gate.