
TL;DR
- I ran a T-Pot honeypot with Suricata for 3 days, not long, but enough to learn lots.
- Cloud IPs are heavily abused for scans; CVEs get probed fast.
- Honeypots are underused, but they don’t have to be. Focus, integration, and purpose make them powerful.
- I’ll dig deeper into container forensics and targeted setups soon (watch this space for a winter update).
- Honeypots are growing fast in value and adoption they’re not just bait, they’re smart sensors for modern defence.
Introduction
It’s strange how satisfying it is to turn off the lights, set up a tent under the stars, and watch the kids swap screen time for mud pies and marshmallows. Before I left for a 3-day family camping trip, I had one last thing to do: set up a T-Pot honeypot safely in a properly isolated DMZ back home.
While we were out in the wild and burning sausages, my honeypot was gathering threat data in the background. That is the great thing about it, if you set it up right, it will work while you don’t. But if you don’t test your setup properly first, you risk leaving a trap for yourself.
Before I let T-Pot loose, I made sure to:
- Contain it fully in a DMZ
- Check for breakout risks
- Confirm there was no accidental access to internal hosts.
- Lock down VLANs and routing paths
Let’s save the whole “how to lock it down properly” bit for another time, that’s not the fun part right now. But if you’re curious or want to set something like this up yourself (especially for schools or universities), feel free to reach out to the DFIR team here at PTP. We’d be more than happy to help get a honeypot up and running as a hands-on learning tool!
My setup
For this honeypot experiment, I kept things simple and used a spare laptop I had lying around. It got a fresh start with a clean install of Ubuntu 24.04, just to make sure nothing old or dodgy was hanging around.
I made sure to enable the firewall (UFW) and set up some basic rules to block any breakout or lateral movement, as I didn’t want the honeypot talking to anything it wasn’t supposed to. Keeping it contained was a priority.
I also tunnelled my browser traffic through SSH and disabled password authentication.
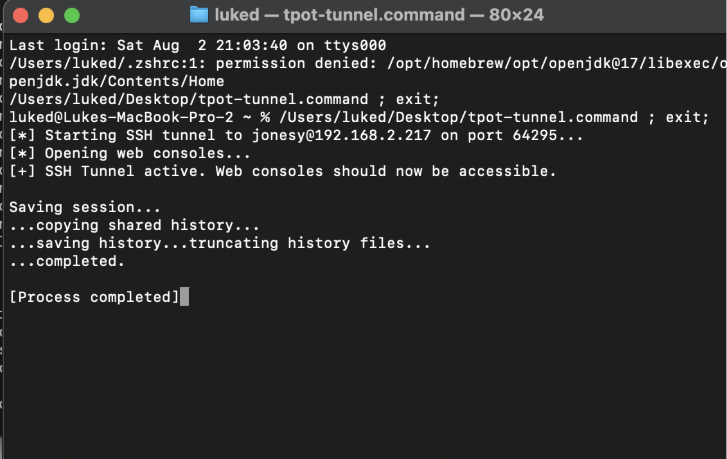
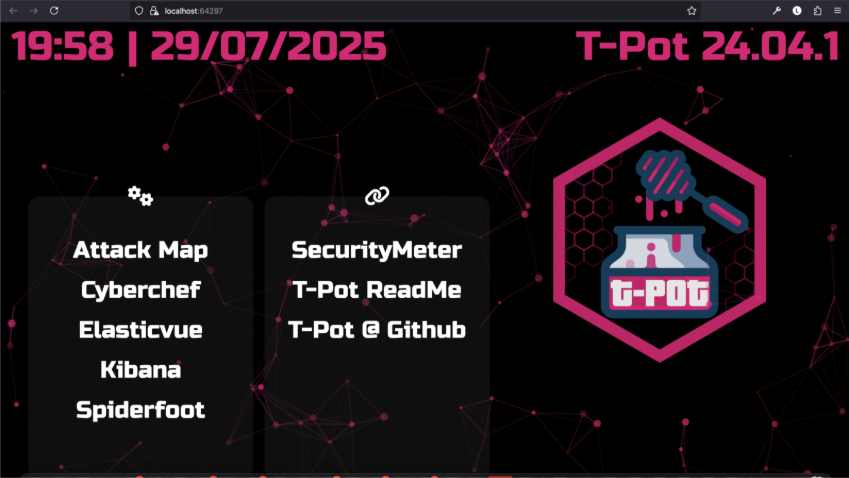
Once that was sorted, I installed T-Pot, which rolled out all the honeypot services I needed in Docker containers. I used Portainer to manage the containers and shipped all logs to an Elasticsearch instance for monitoring. From there, it was just a matter of making sure the box sat safely inside a DMZ and watching the alerts roll in.
So, what am I offering to hackers and what is hosted on each container for management ?
| Container | Service Emulated / Function | Purpose |
| adbhoney | Android Debug Bridge (ADB) | Attracts attacks on Android/IoT devices |
| ciscoasa | Cisco ASA Firewall | Lures network/infrastructure attackers |
| conpot | ICS/SCADA Protocols | Captures industrial attacks (critical infrastructure) |
| cowrie | SSH & Telnet Shell | Logs brute force & malware over SSH/Telnet |
| dicompot | DICOM Medical Imaging | Attracts attacks on medical data |
| dionaea | Multiple Protocols (SMB, FTP, HTTP, etc.) | Collects malware samples |
| elasticpot | Elasticsearch API | Traps database & ransomware scans |
| heralding | Auth Service Emulator (SMTP, POP3, IMAP, FTP, etc.) | Captures stolen credentials |
| honeyaml | Sensitive Config Files | Attracts config scraping attempts |
| honeytrap | Generic TCP/UDP Ports | Records scans/exploits on any port |
| h0neytr4p | Lightweight Multipurpose Sensor | Collects basic attack data |
| ipphoney | Low-level IP Protocols | Captures raw network probes |
| mailoney | SMTP Mail Server | Attracts spam/phishing attempts |
| medpot | Medical Device Protocols | Traps attacks on healthcare IoT |
| miniprint | Network Printer | Logs printer service exploits |
| phpox | PHP-CGI Service | Captures PHP/CGI exploits |
| redis/redishoneypot | Redis Database | Attracts cryptojacking/botnet activity |
| sentrypeer | Threat Intelligence Sharing | Feeds attack data to global threat intel |
| snare | SMB/Windows File Share | Logs ransomware/lateral movement attempts |
| tanner | RDP (Remote Desktop Protocol) | Attracts Windows desktop/RDP exploits |
| wordpot | WordPress Site | Traps attacks on web CMS |
| fatt | Network Traffic Analyzer | Detects suspicious traffic patterns |
| p0f | Passive OS Fingerprinting | Identifies OS from attacker traffic |
| suricata | Network IDS | Flags known attack patterns |
| ewsposter | Elastic Common Schema Log Forwarder | Feeds logs into Elasticsearch |
| elasticsearch | Log Storage/Search Engine | Stores all honeypot data |
| kibana | Analytics Dashboard | Visualises attack trends/logs |
| logstash | Data Pipeline | Processes/feeds logs to search/visual tools |
| map | Attack Map | Shows real-time attack sources/locations |
| spiderfoot | OSINT Automation | Gathers attacker info from public sources |
| nginx | Web Proxy/Frontend | Hosts dashboards or proxies honeypots |
| tpotinit | Orchestration/Startup | Manages all container services |
| portainer | Docker UI | Lets you manage all containers visually |
Getting to know Suricata
One of the tools I ended up spending the most time with was Suricata. I’d never used it before as my IDS/IPS experience was mostly premium solutions such as Cisco Firepower and Palo Alto, so I went in fresh.
Suricata is an open-source engine for network threat detection. It analyses traffic in real time to spot attacks, anomalies, and unusual behaviours. The Open Information Security Foundation (OISF) has maintained it since 2009, and both enterprise and research environments widely use it.
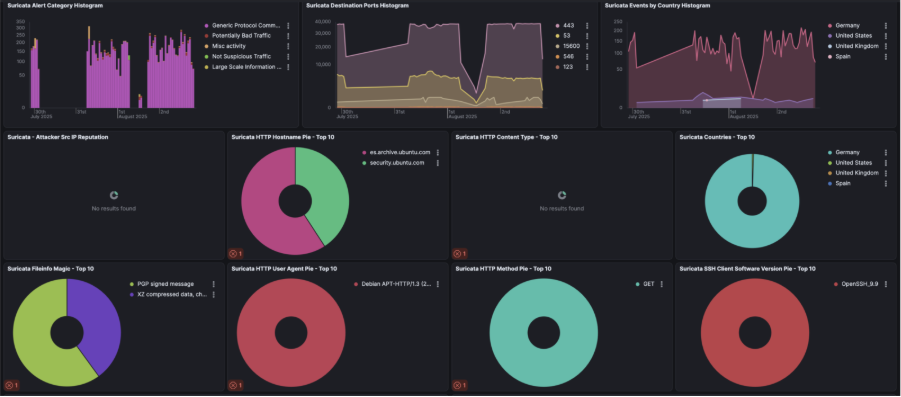
What makes it interesting is that instead of guarding a network perimeter, it focuses entirely on the bait, flagging anything from protocol anomalies and brute-force attempts to CVE exploit scans. I used Kibana to help make sense of it all, and the visibility was impressive.
What did it catch?
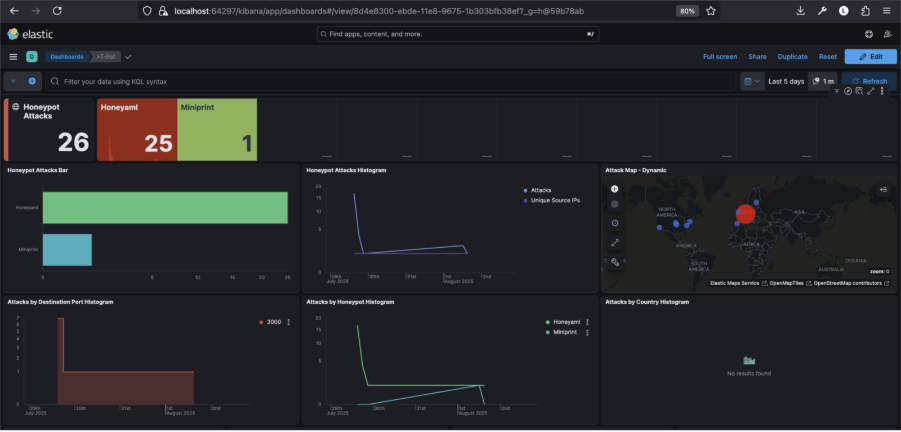
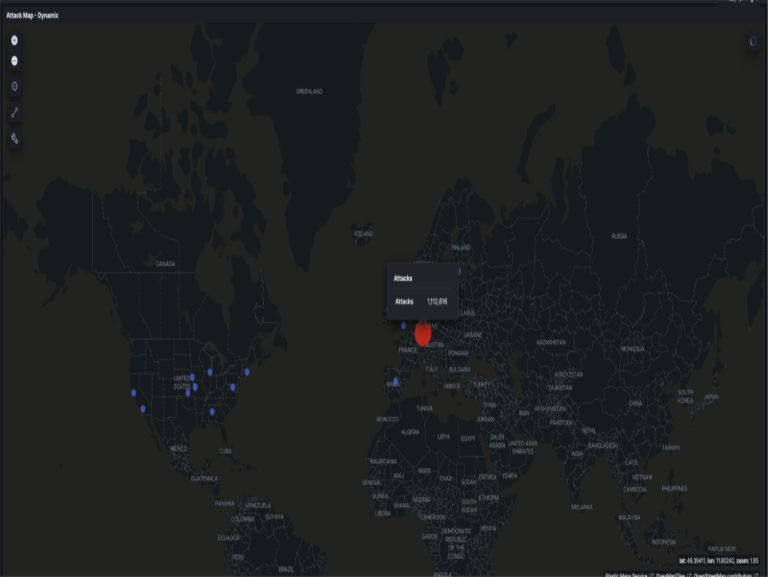
After leaving it running for three days while I was away, I came back to over 1.4 million alerts, which was a lot of noise and not a lot of cool interesting stuff. I wasn’t generous enough to give the hackers any more time, and I appreciate that only 3 days live is not enough to gain real insights, but I saw a few clear patterns nonetheless:
The top traffic sources were Germany, the US, the UK, and Spain (which looked mostly like cloud proxies or compromised servers)
There were frequent offenders, including IPs from GitHub, Amazon EC2, and Google Cloud used for automated scanning.
Plus, a few key CVEs were spotted:
- CVE-2024-6387 (regreSSHion)
- CVE-2020-11910 – Attackers are quick to exploit new (and old) vulnerabilities.
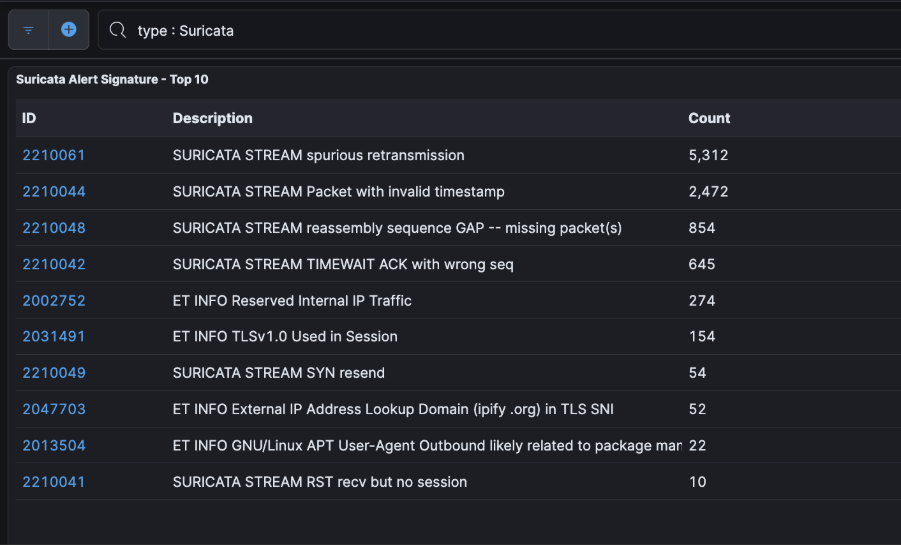
Suricata generates alerts based on rule sets, which are collections of detection rules that define patterns linked to malicious or suspicious traffic. These rules use Suricata’s own syntax and are regularly updated by threat intelligence communities.
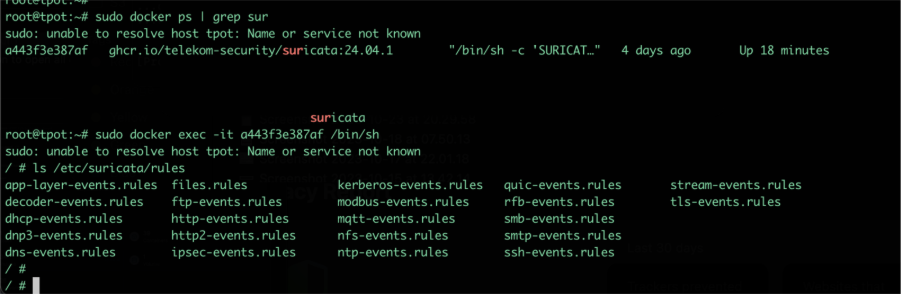
Once you’ve entered the Suricata container (as shown in the screenshot below), you’ll have access to the full set of Suricata rules under /etc/suricata/rules/.
This is where you can:
- Add custom rules tailored to your environment or honeypot use case
- Edit existing ones to tweak their behaviour or reduce noise
- Disable specific rules if they’re too noisy or irrelevant
Each .rules file corresponds to a protocol or category, like http-events.rules, ssh-events.rules, or stream-events.rules. You can use a text editor like vi or nano (if installed) to make changes. Just be sure to reload or restart Suricata inside the container for any updates to take effect.
Back to the analysis
Common targets included ports 443 and 53, with some oddballs like 15600 thrown in. A few weird payloads appeared too PGP messages, .xz file, probing for upload/download capability
Any attribution?
None of the IPs were flagged as part of major threat groups, but that doesn’t mean they’re safe. Most traffic looked automated, not targeted. Just bots scanning whatever’s out there.
My takeaway from analysing this traffic – Cloud IPs: the new playground for attackers
One thing that stood out almost immediately was how often cloud-hosted IPs showed up in the logs. Services from Amazon AWS, Google Cloud, and GitHub were among the top offenders used not for direct attacks, but for automated scanning, recon, and exploitation attempts.
This isn’t just anecdotal. I looked into the topic a little more, and research by GreyNoise shows a clear upward trend in abuse of cloud infrastructure for opportunistic attacks.
Blue Team quick wins?
As a caveat, the balance of access vs risk should be considered by clients before implementing this change. By default, most firewalls don’t “know” if an IP belongs to AWS, Azure, GCP, etc. They look at IP addresses, ports, protocols, and in some cases deep packet inspection (DPI), but they don’t usually perform real-time WHOIS lookups or ASN (Autonomous System Number) resolution on traffic.
Most major cloud platforms publish their current IP ranges in machine-readable formats. Therefore, by building a simple rule to detect inbound traffic from known cloud infrastructure, especially when it’s hitting common service ports like 22 (SSH), 80 (HTTP), 443 (HTTPS), or 3389 (RDP), you can flag likely mass-recon and low-level attacks early. WAFs can also help in this area but need to be well thought out to not prevent legitimate traffic.
A rule outside of the firewall might be better and doesn’t have to be complex. It might check:
- If the source IP is part of a cloud provider’s published IP range
- If the destination port is one commonly targeted by automated tools
If both conditions are met, you generate an alert for potential scanning or early-stage recon. While it may not be a perfect solution, it effectively filters out a significant amount of noise and provides valuable insight into opportunistic traffic that would otherwise be easy to overlook.
Wrapping up: what I’ve learnt (so far)
A few days ago, I spoke with a well experienced security lead who has been in the game for years in both offensive and defensive practices, who said something that stuck with me when I asked, “What’s your take on honeypots’ value? What does a meaningful setup and meaningful output look like to you?”
His response was: “Well, to start, I can tell you that in 20 years I haven’t had a real need for a honeypot.”
That really got me thinking why is that still the case for many security teams? Are honeypots seen as a gimmick? Too niche? Too risky?
After running T-Pot with Suricata in a DMZ for just three days, I can already see how valuable these tools can be when used wisely. But I also get why they’re often underused: many deployments are too broad, unstructured, or treated like novelty traps rather than integrated threat sensors.
Practical ways to get more from honeypots
- Use honeypots with intent and tailor them to mimic critical business systems or known attack surfaces, rather than just throwing everything at the wall.
- Integrate them with threat intelligence tools and enrich IOCs from honeypots with context from platforms like GreyNoise or AbuseIPDB.
- Automate responses including triggering alerts, blocklists, or isolating segments when specific patterns are observed.
- Use them to test blue team assumptions: simulate attacks and watch how detection workflows respond in real time.
- Turn them into learning sandboxes: because they are great for SOC training, malware detonation, or behaviour analysis.
- Open-source IDS tools like Suricata can help smaller organisations that can’t afford premium services. With a straightforward setup, a local IT provider could have one running in a day.
What’s next?
I’ll be using Portainer to spin up more targeted container honeypots instead of deploying everything at once. A tighter scope should give me more meaningful data and reduce noise from generic probes.
That said, T-Pot and Suricata have already delivered:
- Some quick wins (like seeing CVEs scanned within 24 hours of disclosure)
- A better understanding of rule tuning and network visibility
- A chance to explore some very useful tooling I hadn’t used before and can recommend to clients
Final thoughts on honeypot adoption
Three days was enough to prove the point. The internet is noisy and opportunistic. A focused honeypot turns that noise into useful signal. Done right, it gives defenders a low-cost way to learn, test assumptions, and spot early-stage recon without touching production.
However, it must be deployed safely, in a DMZ with restricted egress. Start narrow for practical value. Emulate one or two services that match your environment. Enrich with ASN and cloud provider tags. Tune Suricata on a regular cadence. Then use the output to update blocklists, write new rules, and train analysts. For students, small teams, and busy blue teams, this is an accessible step towards better visibility.