Introduction
Microsoft Patches for October 2018 included a total of 49 security patches. There were many interesting ones including kernel privilege escalation as well as critical ones which could lead to remote code execution such as the MSXML one. In this post we will be analysing a case of a WMF out-of-bounds read vulnerability and then we will try to determine its exploitability.
We reported this to Microsoft and they addressed the bug and assigned CVE-2018-8472 for the case. This analysis was performed on a Windows 10 x64 using a 32-bit harness.
Similar to Markus Gaasedelen’s Timeless Debugging of Complex Software using Mozilla’s rr tool blog post we will be using the Windows Debugger Preview and take advantage of its Time Travelling Debugging (TTD) features and identify the root cause of slightly complex code.
Time Travelling Debugging allows you to capture a trace that goes backwards and forth in time and analyse the vulnerability, we’re are going to be using these fantastic features to identify all the user input that can influence the crash as well as understand the bug itself. Although previous research has been conducted on the EMF fileformat, the presented vulnerability was discovered via fuzzing WMF files using winafl. A call to gdiplus!GpImage::LoadImageW function with a specially crafted WMF file will yield the following crash:
(388.1928): Access violation - code c0000005 (!!! second chance !!!)
eax=00000012 ebx=00000000 ecx=00000001 edx=d0d0d0d0 esi=08632000 edi=086241c0
eip=74270b37 esp=00eff124 ebp=00eff14c iopl=0         nv up ei pl nz na po nc
cs=0023  ss=002b  ds=002b  es=002b  fs=0053  gs=002b             efl=00010202
ucrtbase!memcpy+0x507:
74270b37 8b16            mov     edx,dword ptr [esi]  ds:002b:08632000=????????
From the crash above, we are trying to copy the memory contents pointed by esi (08632000) and move that to the edx register. However, it looks like esi points to unmapped memory:
0:000> dc esi L10
08632000  ???????? ???????? ???????? ????????  ????????????????
08632010  ???????? ???????? ???????? ????????  ????????????????
08632020  ???????? ???????? ???????? ????????  ????????????????
08632030  ???????? ???????? ???????? ????????  ????????????????
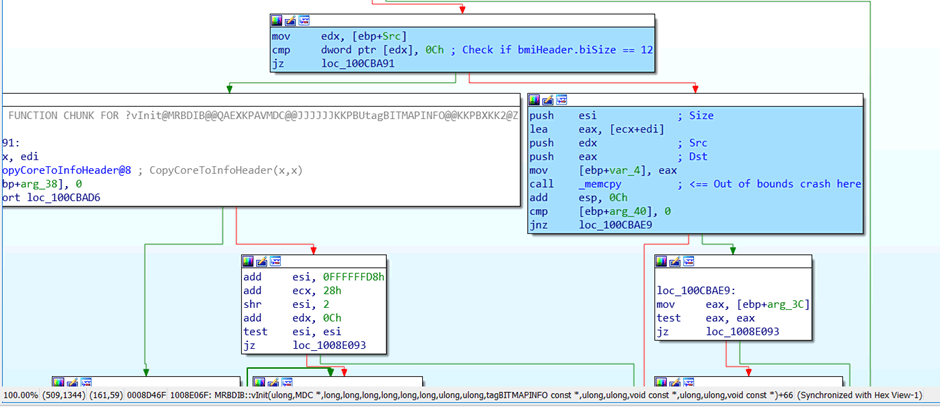
Figure 1: Executed instructions while running the crafted WMF file.
Next step is to look at the stack trace and understand how we ended up on this memcpy function:
0:000> kv
 # ChildEBP RetAddr  Args to Child
00 00eff128 76d6e086 08624154 08631f94 00000072 ucrtbase!memcpy+0x507 (FPO: [3,0,2])
01 00eff14c 76d6dfd9 00000051 08621d20 00000000 gdi32full!MRBDIB::vInit+0x7d (FPO: [Non-Fpo])
02 00eff200 76d6da5f ffffff00 00001400 00001400 gdi32full!MF_AnyDIBits+0x167 (FPO: [Non-Fpo])
03 00eff334 74743ca3 75211255 00000000 ffffff00 gdi32full!StretchDIBitsImpl+0xef (FPO: [Non-Fpo])
04 00eff374 76da86ec 75211255 00000000 ffffff00 GDI32!StretchDIBits+0x43 (FPO: [Non-Fpo])
05 00eff494 76d69164 75211255 0862dff0 0861be96 gdi32full!PlayMetaFileRecord+0x3f3ec
06 00eff544 76d9749d 00000000 00000000 00eff568 gdi32full!CommonEnumMetaFile+0x3a5 (FPO: [Non-Fpo])
07 00eff554 74745072 75211255 d0261074 0049414e gdi32full!PlayMetaFile+0x1d (FPO: [Non-Fpo])
08 00eff568 71ac9eb1 75211255 d0261074 d0261074 GDI32!PlayMetaFileStub+0x22 (FPO: [Non-Fpo])
09 00eff5fc 71ac9980 09c39e18 000001e4 00000000 gdiplus!GetEmfFromWmfData+0x4f5 (FPO: [Non-Fpo])
0a 00eff624 71a9bd6a 09c33f3c 09c33fd0 00000000 gdiplus!GetEmfFromWmf+0x69 (FPO: [Non-Fpo])
0b 00eff770 71a8030c 09c33f3c 09c33fd0 00eff794 gdiplus!GetHeaderAndMetafile+0x1b970
0c 00eff79c 71a690f4 09c37fc8 00000001 71b59ec4 gdiplus!GpMetafile::InitStream+0x4c (FPO: [Non-Fpo])
0d 00eff7c0 71a77280 085a3fd0 00000000 09c31ff0 gdiplus!GpMetafile::GpMetafile+0xc2 (FPO: [Non-Fpo])
0e 00eff7e4 71a771e1 09c31ff0 00000000 0859cfeb gdiplus!GpImage::LoadImageW+0x36 (FPO: [Non-Fpo])
0f 00eff800 00311107 085a3fd0 09c31ff4 085a3fd0 gdiplus!GdipLoadImageFromFile+0x51 (FPO: [Non-Fpo])
--- redacted ---
Interesting, we can see the memcpy was called from the MRBDIB::vInit() function, which in turn was called from StretchDIBits, PlayMetaFileRecord, CommonEnumMetaFile and a few other functions.
Moreover, let’s observe the esi value and the size allocation:
0:000> !heap -p -a esi
    address 08632000 found in
    _DPH_HEAP_ROOT @ 5781000
    in busy allocation (  DPH_HEAP_BLOCK:         UserAddr         UserSize -         VirtAddr         VirtSize)
                                 a2b0a90:          8631f78               84 -          8631000             2000
          unknown!noop
    6afca8d0 verifier!AVrfDebugPageHeapAllocate+0x00000240
    773b4b16 ntdll!RtlDebugAllocateHeap+0x0000003c
    7730e3e6 ntdll!RtlpAllocateHeap+0x000000f6
    7730cfb7 ntdll!RtlpAllocateHeapInternal+0x000002b7
    7730ccee ntdll!RtlAllocateHeap+0x0000003e
    76af9f10 KERNELBASE!LocalAlloc+0x00000080
    76da8806 gdi32full!PlayMetaFileRecord+0x0003f506
    == redacted ==
So as we can see the allocated size was 0x84 bytes, which we will pinpoint later and identify where that value came from.
Crash minimisation and quick intro to Windbg’s Preview TTD features
The WMF is a very complicated file format (and deprecated) and the next step is to minimise the test case!
For this process, I’ve used Axel Souchet‘s afl-tmin tool which comes with winafl. The following command was used to minimise the crasher:
afl-tmin.exe -D C:\DRIO\bin32 -i C:\Users\symeon\Desktop\GDI\crasher_84.wmf -o C:\Users\symeon\Desktop\GDI\crasher_MIN.wmf -- -covtype edge -coverage_module GDI32.dll -target_method fuzzit -nargs 2 -- C:\Users\symeon\Desktop\GDI\GdiRefactor.exe @@
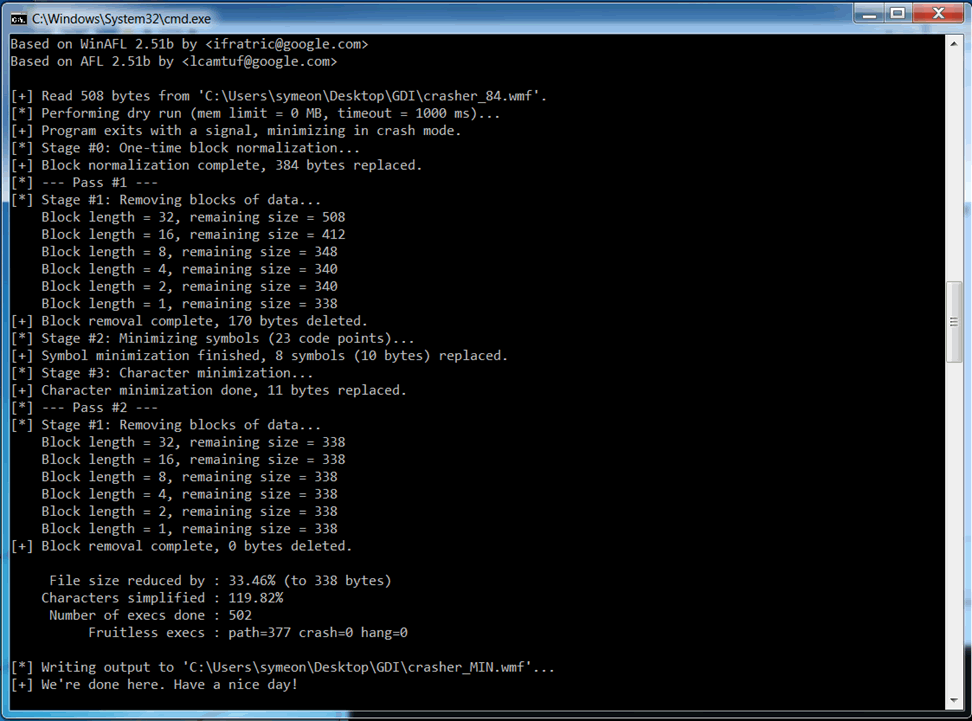
Figure 2: Minimising the original crash file.
Comparing the differences between the original and the minimised test case we can see that now is much easier to work with the minimised case. Notice how the tool modified the non-interesting bytes to null bytes (0x30) and kept only the important ones that lead to the crash! This effectively helps us identify which bytes the user can control, and how we could modify them as we will cover on the second part.
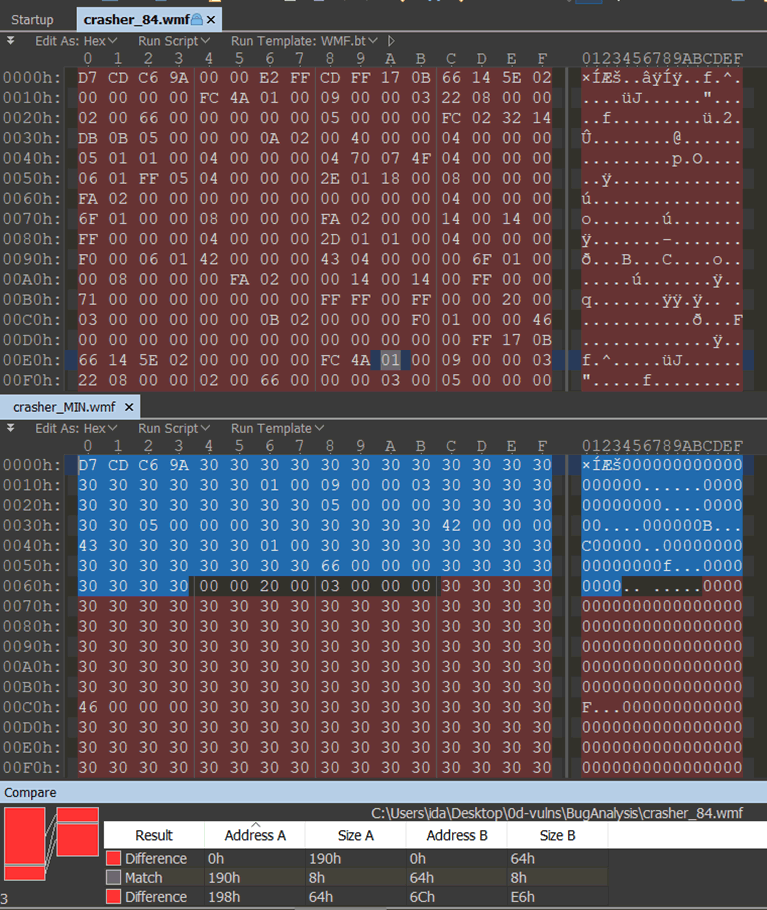
Figure 3: Comparisons between the original and the minimised.
With the minimised test case it’s time to fire up Windbg Preview and record the trace. In order to record the trace Windbg Preview requires admin privileges. With Windbg running click on File -> Start Debugging -> Launch Executable Advance and make sure “Record process with Time Travel Debugging” is enabled.
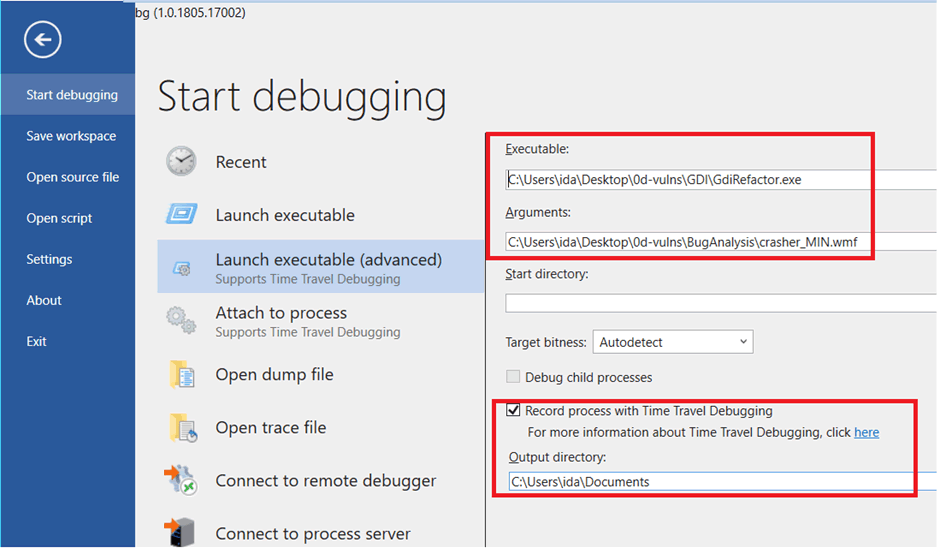
Figure 4: Windg Preview capturing new trace
Starting the trace with the harness and the crasher, and continuing the execution will give you the following screenshot:
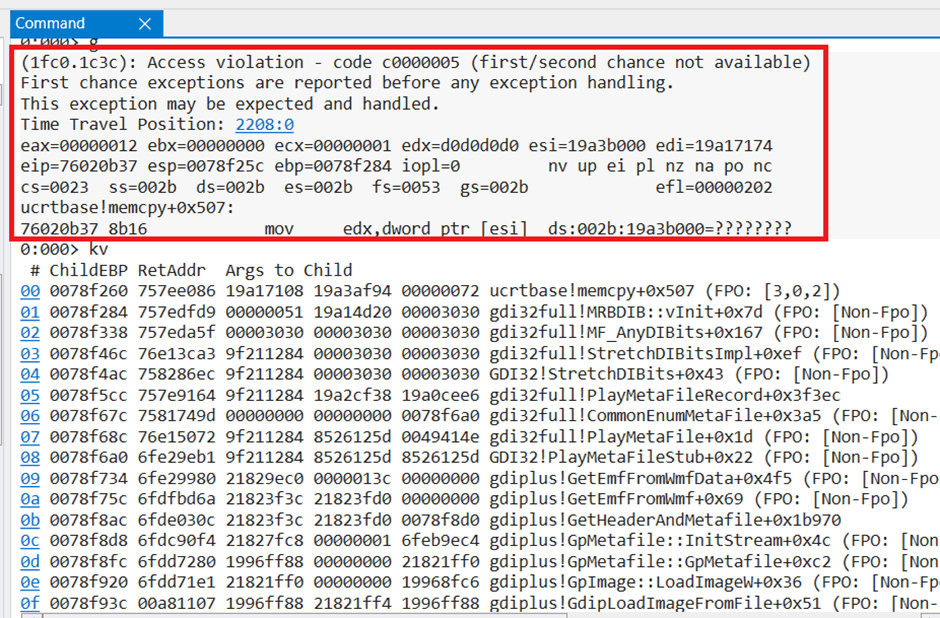
Figure 5: Executing the harness with the crasher resulting in a memcpy crash
If you haven’t watched the videos from Microsoft we highly recommend you do, but in short:
g- and !tt 00 will move us back to the initial state of the trace (the latter is in percentage format, e.g. !tt 50 will travel in the middle of the trace).
p- will step into one command backwards, can be used in combination with p- 10 we can go back n commands.
What makes time travelling awesome is that once the trace is recorded all of the memory/heap allocations/offsets will stay the same. This quickly allows to inspect function parameters, as well as memory addresses pointing to interesting data.
Identifying the root cause
Let’s print the stack trace once again, we are going to start from the bottom of the trace and work up, examining the function calls on each trace and printing the parameters.
0:000> kv 6
 # ChildEBP RetAddr  Args to Child
00 0078f260 757ee086 19a17108 19a3af94 00000072 ucrtbase!memcpy+0x507 (FPO: [3,0,2])
01 0078f284 757edfd9 00000051 19a14d20 00003030 gdi32full!MRBDIB::vInit+0x7d (FPO: [Non-Fpo])
02 0078f338 757eda5f 00003030 00003030 00003030 gdi32full!MF_AnyDIBits+0x167 (FPO: [Non-Fpo])
03 0078f46c 76e13ca3 9f211284 00003030 00003030 gdi32full!StretchDIBitsImpl+0xef (FPO: [Non-Fpo])
04 0078f4ac 758286ec 9f211284 00003030 00003030 GDI32!StretchDIBits+0x43 (FPO: [Non-Fpo])
05 0078f5cc 757e9164 9f211284 19a2cf38 19a0cee6 gdi32full!PlayMetaFileRecord+0x3f3ec
Let’s see where the PlayMetaFileRecord was called.
Now it’s time to utilize windbg’s preview Time Travel Debugging (TTD) features and let’s travel back in time!
One way is to use the following LINQ query and print all the TTD calls for the PlayMetaFileRecord that occur over the course of a trace:
0:000> dx -r1 @$cursession.TTD.Calls("gdi32full!PlayMetaFileRecord")
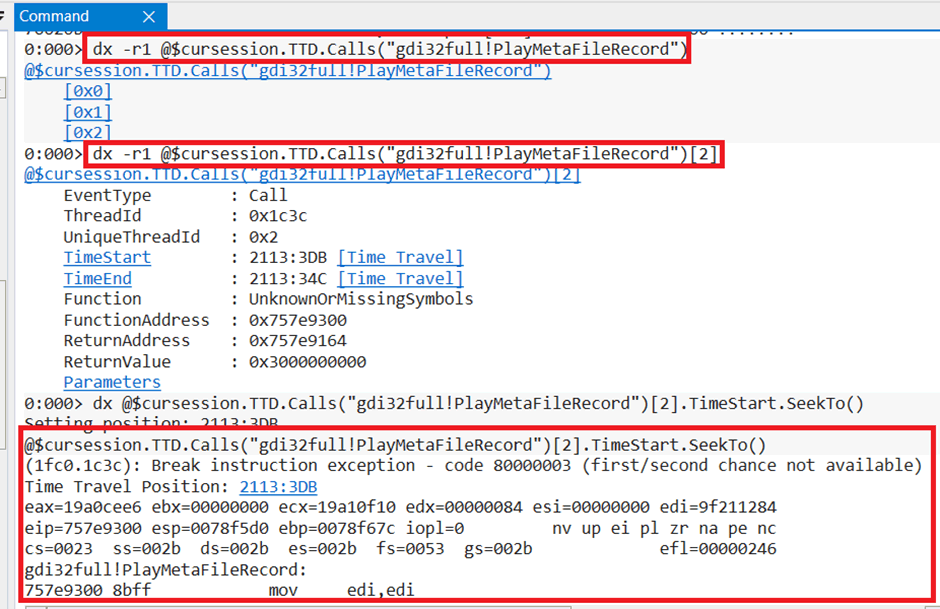
Figure 6: Trace location that called the PlayMetaFileRecord
Fantastic, the above query yielded a total of three calls. Clicking on the last result will give us the last call and the following information (as depicted above):
0:000> dx -r1 @$cursession.TTD.Calls("gdi32full!PlayMetaFileRecord")[2]
@$cursession.TTD.Calls("gdi32full!PlayMetaFileRecord")[2]
    EventType        : Call
    ThreadId         : 0x1c3c
    UniqueThreadId   : 0x2
    TimeStart        : 2113:3DB [Time Travel]
    TimeEnd          : 2113:34C [Time Travel]
    Function         : UnknownOrMissingSymbols
    FunctionAddress  : 0x757e9300
    ReturnAddress    : 0x757e9164
    ReturnValue      : 0x3000000000
    Parameters
Clicking again on the Time Travel within the TimeStart property will transfer us to that call (Figure 4):
0:000> dx @$cursession.TTD.Calls("gdi32full!PlayMetaFileRecord")[2].TimeStart.SeekTo()
Setting position: 2113:3DB
@$cursession.TTD.Calls("gdi32full!PlayMetaFileRecord")[2].TimeStart.SeekTo()
(1fc0.1c3c): Break instruction exception - code 80000003 (first/second chance not available)
Time Travel Position: 2113:3DB
eax=19a0cee6 ebx=00000000 ecx=19a10f10 edx=00000084 esi=00000000 edi=9f211284
eip=757e9300 esp=0078f5d0 ebp=0078f67c iopl=0         nv up ei pl zr na pe nc
cs=0023  ss=002b  ds=002b  es=002b  fs=0053  gs=002b             efl=00000246
gdi32full!PlayMetaFileRecord:
757e9300 8bff            mov     edi,edi
Entering p- will step one command backwards and right before the call so we can inspect the parameters:
0:000> p-
Time Travel Position: 2113:3DA
eax=19a0cee6 ebx=00000000 ecx=19a10f10 edx=00000084 esi=00000000 edi=9f211284
eip=757e915f esp=0078f5d4 ebp=0078f67c iopl=0         nv up ei pl zr na pe nc
cs=0023  ss=002b  ds=002b  es=002b  fs=0053  gs=002b             efl=00000246
gdi32full!CommonEnumMetaFile+0x3a0:
757e915f e89c010000      call    gdi32full!PlayMetaFileRecord (757e9300)
Another way would be to use the Unassemble backwards command (using the return address from the previous stack trace #05) (Figure 3):
0:000> ub 757e9164
gdi32full!CommonEnumMetaFile+0x38f:
757e914e 1485            adc     al,85h
757e9150 db0f            fisttp  dword ptr [edi]
757e9152 853de80300ff    test    dword ptr ds:[0FF0003E8h],edi
757e9158 75cc            jne     gdi32full!CommonEnumMetaFile+0x367 (757e9126)
757e915a 50              push    eax
757e915b ff75c4          push    dword ptr [ebp-3Ch]
757e915e 57              push    edi
757e915f e89c010000      call    gdi32full!PlayMetaFileRecord (757e9300)
and then use the g- to travel once again back in time from the current fault position:
0:000> g- 757e915f
Time Travel Position: 2113:3DA
eax=19a0cee6 ebx=00000000 ecx=19a10f10 edx=00000084 esi=00000000 edi=9f211284
eip=757e915f esp=0078f5d4 ebp=0078f67c iopl=0         nv up ei pl zr na pe nc
cs=0023  ss=002b  ds=002b  es=002b  fs=0053  gs=002b             efl=00000246
gdi32full!CommonEnumMetaFile+0x3a0:
757e915f e89c010000      call    gdi32full!PlayMetaFileRecord (757e9300)
Examining the PlayMetaFileRecord from Microsoft’s documentation reveals that
“The PlayMetaFileRecord function plays a Windows-format metafile record by executing the graphics device interface (GDI) function contained within that record.”
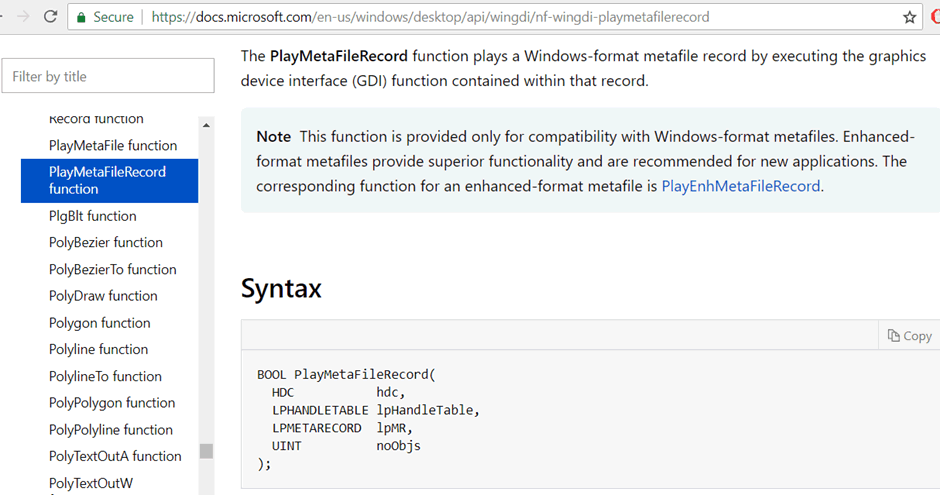
Figure 7: GDI32 PlayMetaFileRecord API documentation.
The next step would be to print and examine the parameters right before stepping into the function:
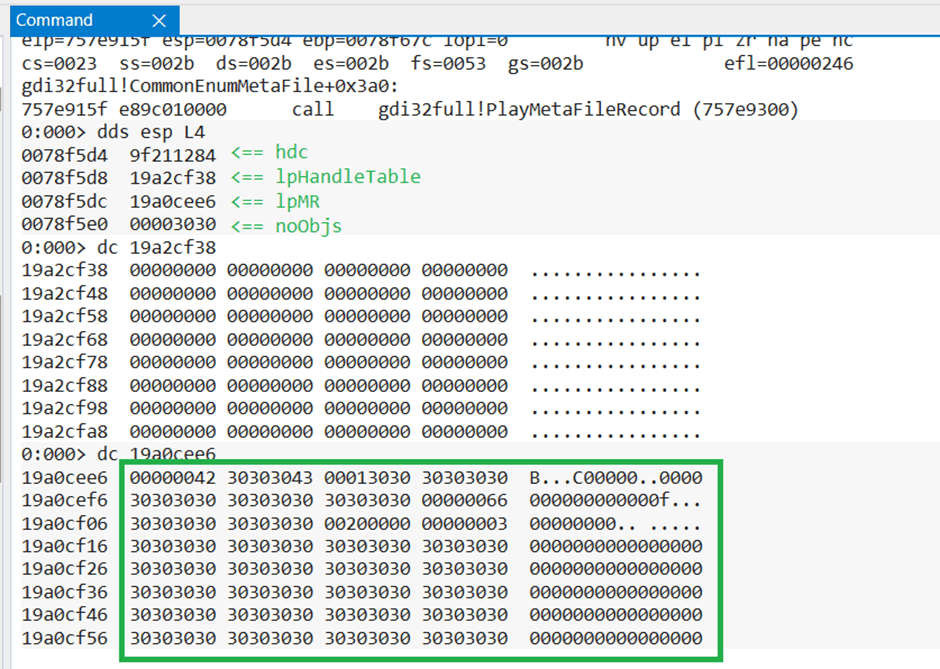
Figure 8: Dumping the memory contents of the PlayMetaFileRecord’s parameters.
Notice that the LPMETARECORD looks familiar, in fact if we open the crasher on a hex editor we will see the following:
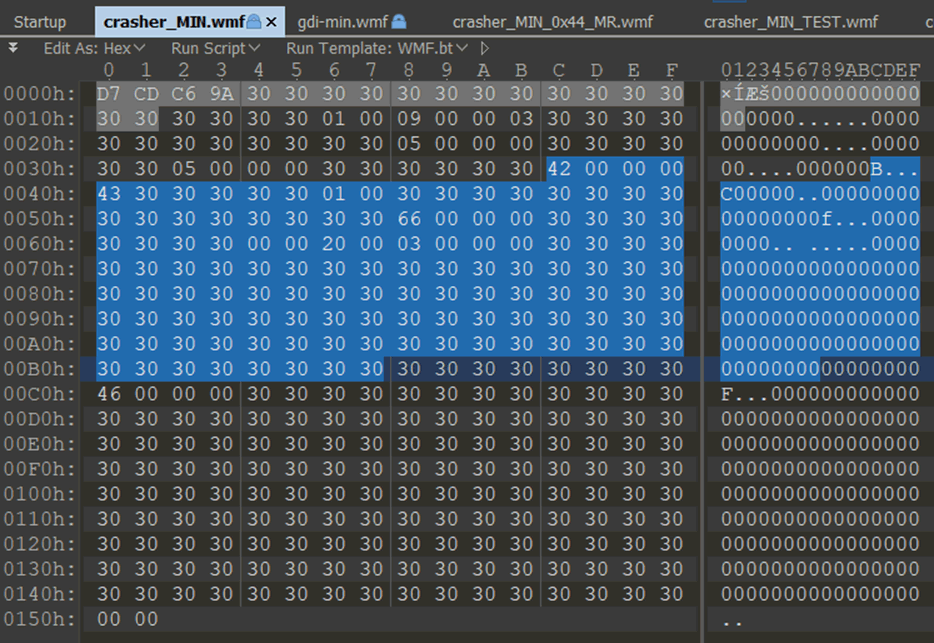
Figure 9: LPMETARECORD in big-endian format inside the WMF file contents
Continuing let’s examine the StretchDIBits function:
0:000> ub 758286ec
gdi32full!PlayMetaFileRecord+0x3f3d3:
758286d3 0fbf4316        movsx   eax,word ptr [ebx+16h]
758286d7 50              push    eax
758286d8 0fbf4318        movsx   eax,word ptr [ebx+18h]
758286dc 50              push    eax
758286dd 0fbf431a        movsx   eax,word ptr [ebx+1Ah]
758286e1 50              push    eax
758286e2 ff742444        push    dword ptr [esp+44h]
758286e6 ff1588d08975    call    dword ptr [gdi32full!_imp__StretchDIBits (7589d088)]
Once again let’s read a bit about the StretchDIBits function:
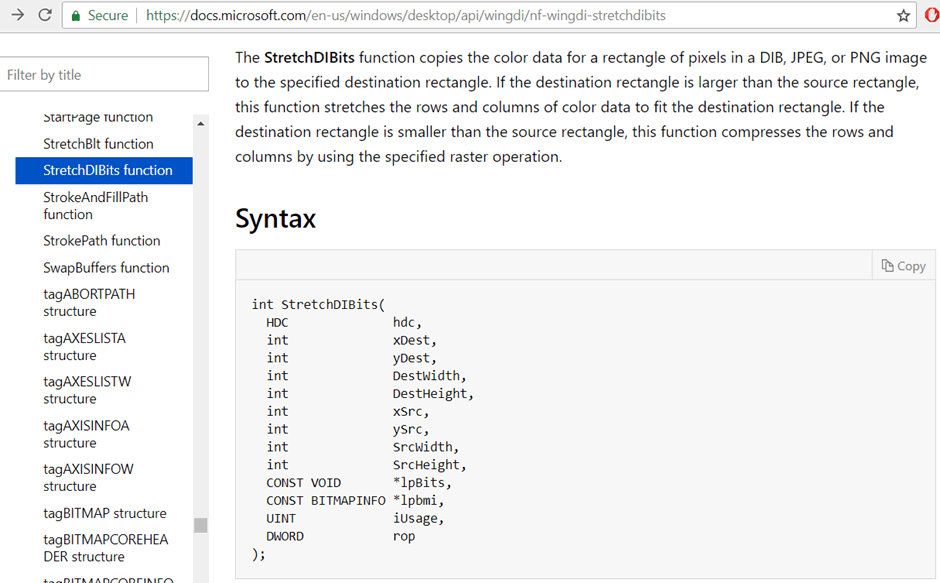
Figure 10: The StretchDIBits function
This function expects a total of 13 parameters, let’s confirm if we are on the right track:
0:000> g 758286e6
ModLoad: 73610000 73689000   C:\WINDOWS\system32\uxtheme.dll
Time Travel Position: 2152:264
eax=00003030 ebx=19a3af78 ecx=30303030 edx=19a3af94 esi=19a3af94 edi=19a3affa
eip=758286e6 esp=0078f4b4 ebp=0078f5cc iopl=0         nv up ei pl nz na pe nc
cs=0023  ss=002b  ds=002b  es=002b  fs=0053  gs=002b             efl=00000206
gdi32full!PlayMetaFileRecord+0x3f3e6:
758286e6 ff1588d08975    call    dword ptr [gdi32full!_imp__StretchDIBits (7589d088)] ds:002b:7589d088={GDI32!StretchDIBits (76e13c60)}
And printing again the parameters right before the call:
0:000> dds esp LD
0078f4b4  9f211284 <== hdc
0078f4b8  00003030 <== xDest
0078f4bc  00003030 <== yDest
0078f4c0  00003030 <== DestWidth
0078f4c4  00003030 <== DestHeight
0078f4c8  00003030 <== xSrc
0078f4cc  00003030 <== ySrc
0078f4d0  00003030 <== SrcWidth
0078f4d4  00003030 <== SrcHeight
0078f4d8  19a3affa <== *lpBits
0078f4dc  19a3af94 <== *lpbmi
0078f4e0  00000001 <== iUsage
0078f4e4  30303030 <== rop
Out of all these values we’re interested on the *lpbmi value which is a pointer to BITMAPINFO structure.
The BITMAPINFO structure is defined as below:
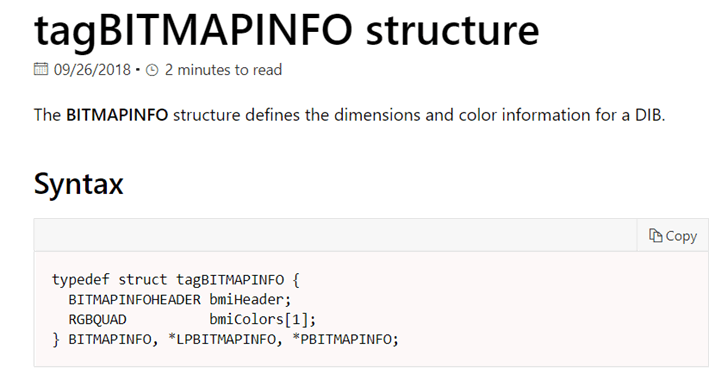
The bmiHeader is also a member of the BITMAPINFOHEADER structure that contains information about the dimensions and color format of a DIB.
That structure is defined as below:
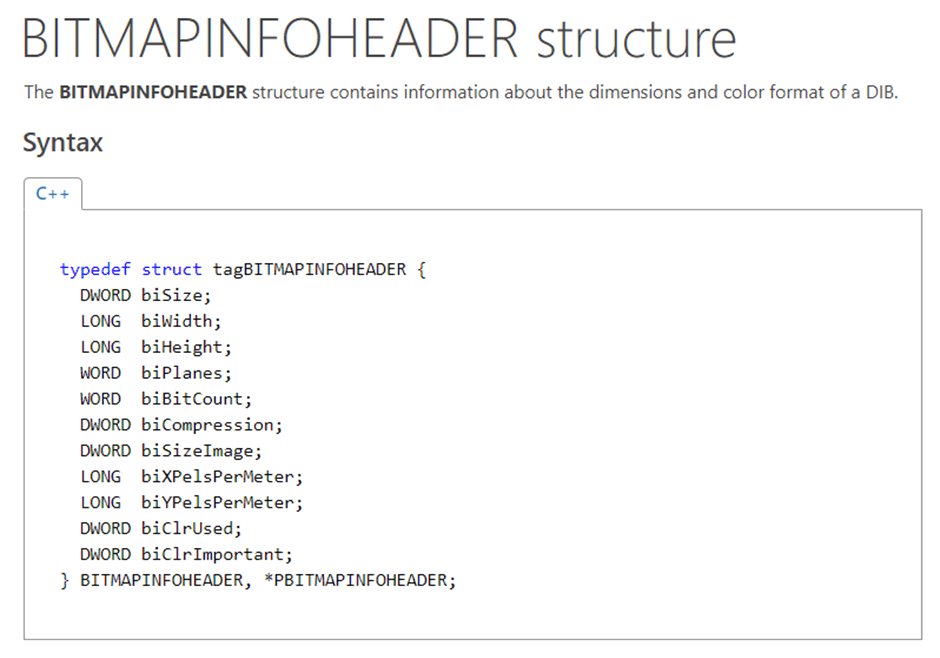
Figure 11: The BITMAPINFOHEADER structure.
Let’s examine the lpbmi memory contents:
0:000> dc 19a3af94
19a3af94  00000066 30303030 30303030 00200000  f...00000000.. .
19a3afa4  00000003 30303030 30303030 30303030  ....000000000000
19a3afb4  00000000 30303030 30303030 30303030  ....000000000000
19a3afc4  30303030 30303030 30303030 30303030  0000000000000000
19a3afd4  30303030 30303030 30303030 30303030  0000000000000000
19a3afe4  30303030 30303030 30303030 30303030  0000000000000000
19a3aff4  30303030 30303030 d0d0d0d0 ????????  00000000....????
19a3b004  ???????? ???????? ???????? ????????  ????????????????
This also looks familiar, the above bytes start at offset 0x58 of our seed file. Continuing, let’s examine the MF_AnyDIBits function:
0:000> ub 757eda5f
gdi32full!StretchDIBitsImpl+0xd3:
757eda43 8b4c2434        mov     ecx,dword ptr [esp+34h]
757eda47 ff7524          push    dword ptr [ebp+24h]
757eda4a ff742468        push    dword ptr [esp+68h]
757eda4e ff751c          push    dword ptr [ebp+1Ch]
757eda51 ff7518          push    dword ptr [ebp+18h]
757eda54 ff7514          push    dword ptr [ebp+14h]
757eda57 ff7510          push    dword ptr [ebp+10h]
757eda5a e813040000      call    gdi32full!MF_AnyDIBits (757ede72)
Unfortunately, there’s no documentation for this one, but luckily IDA can help us with that:
size_t __stdcall MF_AnyDIBits(HDC a1, int a2, int a3, int a4, int a5, int a6, int a7, unsigned __int32 a8, unsigned __int32 a9, unsigned __int32 a10, UINT cLines, void *lpBits, BITMAPINFOHEADER *pbmih, UINT ColorUse, unsigned __int32 a15, int a16)
This function expects 16 arguments as seen above, however we’re only interested on the *lpBits and *pbmi pointers.
0:000> dds esp LF
0078f340  00003030
0078f344  00003030
0078f348  00003030
0078f34c  00003030
0078f350  00003030
0078f354  00003030
0078f358  00003030
0078f35c  00000000
0078f360  00000000
0078f364  19a3affa <== *lpBits
0078f368  19a3af94 <== *lpbmi
0078f36c  00000001
0078f370  30303030
0078f374  00000051
0078f378  19a3affa <== *lpBits
Finally, there’s one function that we need to analyse right before crashing, the MRBDIB::vInit:
0:000> ub 757edfd9
gdi32full!MF_AnyDIBits+0x152:
757edfc4 ff751c          push    dword ptr [ebp+1Ch]
757edfc7 50              push    eax
757edfc8 ff7514          push    dword ptr [ebp+14h]
757edfcb ff7508          push    dword ptr [ebp+8]
757edfce ff75b0          push    dword ptr [ebp-50h]
757edfd1 56              push    esi
757edfd2 6a51            push    51h
757edfd4 e830000000      call    gdi32full!MRBDIB::vInit (757ee009)
The MRBDIB::vInit has the following signature and expects a total of 18 parameters:
void __thiscall MRBDIB::vInit(MRBDIB *this, unsigned int, struct MDC *, int, int, int, int, int, int, unsigned int, size_t Size, const struct tagBITMAPINFO *Src, unsigned int, size_t, const void *, unsigned int, size_t, const void *)
From our analysis IDA didn’t successfully recognize correct this function, you can see the last argument before the call is 0x51 and does not match with the MRBDIB *this parameter.
However, after researching a bit and from the documentation the first value identifies the record type, for this case this is clearly EMR_STRETCHDIBITS.
The documentation also states:
“The EMR_STRETCHDIBITS record specifies a block transfer of pixels from a source bitmap to a destination rectangle, optionally in combination with a brush pattern, according to a specified raster operation, stretching or compressing the output to fit the dimensions of the destination, if necessary.”
With that info, let’s dump the parameters before the MRBDIB::vInit() call and try to match the EMR_STRETCHDIBITS record.
0:000> dds esp LD
0078f28c  00000051 <== EMR_STRETCHDIBITS
0078f290  19a14d20 <== Bounds
0078f294  00003030 <== xDest
0078f298  00003030 <== yDest
0078f29c  00003030 <== xSrc
0078f2a0  00003030 <== ySrc
0078f2a4  00003030 <== cxSrc
0078f2a8  00003030 <== cySrc
0078f2ac  00000050 <== offBmiSrc/offBitsInfoDib1
0078f2b0  00000072 <== cbBmiSrc/cbBitsInfoDib1
0078f2b4  19a3af94 <== offBitsSrc
0078f2b8  000000c4 <== cbBitsSrc
0078f2bc  00000000 <== UsageSrc
0078f2c0  19a3affa <== BitBltRasterOperation
0078f2c4  00000001 <== cxDest
0078f2c8  00000000 <== cyDest
0078f2cc  00000000 <== BitmapBuffer
0078f2d0  00000000 <== BitmapBuffer?
There are a few interesting values here that we might need to be aware of:
offBmiSrc (4 bytes): An unsigned integer that specifies the offset in bytes from the start of this record to the source bitmap header.
cbBmiSrc (4 bytes): An unsigned integer that specifies the size in bytes, of the source bitmap header.
offBitsSrc (4 bytes): An unsigned integer that specifies the offset in bytes, from the start of this record to the source bitmap bits.
cbBitsSrc (4 bytes): An unsigned integer that specifies the size in bytes, of the source bitmap bits.
Before stepping into the MRBDIB::vInit, let’s examine MRBDIB class. Luckily we were able to find the following class definition which albeit outdated, it gave us an overview of the class’ member variables:
class MRBDIB : public MR        /* mrsdb */
{
protected:
    LONG        xDst;           // destination x origin
    LONG        yDst;           // destination y origin
    LONG        xDib;           // dib x origin
    LONG        yDib;           // dib y origin
    LONG        cxDib;          // dib width
    LONG        cyDib;          // dib height
    DWORD       offBitsInfoDib; // offset to dib info, we don't store core info.
    DWORD       cbBitsInfoDib;  // size of dib info
    DWORD       offBitsDib;     // offset to dib bits
    DWORD       cbBitsDib;      // size of dib bits buffer
    DWORD       iUsageDib;      // color table usage in bitmap info.
-- redacted--
Let’s print again the offBitsSrc contents:
0:000> dc 19a3af94
19a3af94  00000066 30303030 30303030 00200000  f...00000000.. .
19a3afa4  00000003 30303030 30303030 30303030  ....000000000000
19a3afb4  00000000 30303030 30303030 30303030  ....000000000000
19a3afc4  30303030 30303030 30303030 30303030  0000000000000000
19a3afd4  30303030 30303030 30303030 30303030  0000000000000000
19a3afe4  30303030 30303030 30303030 30303030  0000000000000000
19a3aff4  30303030 30303030 d0d0d0d0 ????????  00000000....????
19a3b004  ???????? ???????? ???????? ????????  ????????????????
With that information and stepping into the MRBDIB::vInit function, after the variable initialisation, the following instructions will be executed:
-- redacted --
757ee065 895740         mov     dword ptr [edi+40h], edx
757ee068 85f6           test    esi, esi                 ;  esi holds the cbBmiSrc value (0x72)
757ee06a 742a           je      gdi32full!MRBDIB::vInit+0x8d (757ee096)
757ee06c 8b5530         mov     edx, dword ptr [ebp+30h] ; lpbmi/offBitsSrc value gets dereferenced on edx
757ee06f 833a0c         cmp     dword ptr [edx], 0Ch     ; compare to biSize to 12
757ee072 0f8419da0300   je      gdi32full!MRBDIB::vInit+0x3da88 (7582ba91)
757ee078 56             push    esi                      ; push cbBmiSrc, 0x72
757ee079 8d0439         lea     eax, [ecx+edi]           ; calculate source address and move to eax.
757ee07c 52             push    edx                      ; push edx, destination address
757ee07d 50             push    eax                      ; push the address to the stack
757ee07e 8945fc         mov     dword ptr [ebp-4], eax
757ee081 e815560300     call    gdi32full!memcpy (7582369b)
Essentially, it is first checked whether the cbBmiSrc variable has a value (0x72 for this case), and then if offBitsSrc->bmiHeader.biSize is equal to 12. If that value is 12, it’s going to extend it to a bitmapinfoheader. Remember that the minimum value for the bcSize field of bitmapcoreheader is 0xc and that of bitmapinfoheader is 0x28 (header size). The current biSize within the bmiHeader is in fact 0x66 (which is user controlled). As a result, it’s parsed as a BITMAPINFOHEADER structure and the memcpy leads to an out-of-bounds vulnerability.
The pseudocode would be:
if ( cbBmiSrc )
  {
    if ( offBitsSrc->bmiHeader.biSize == 12 )
    {
      v19 = (unsigned __int32)v18 + offBmiSrc;
      CopyCoreToInfoHeader((char *)v18 + offBmiSrc, offBitsSrc);
      -- snip --
     }
         else
    {
      memcpy((char *)v18 + offBmiSrc, offBitsSrc, cbBmiSrc);
      -- snip --
     }
   }
And stepping into the memcpy():
0:000>
Time Travel Position: 21DD:31
eax=19a17108 ebx=00000000 ecx=00000050 edx=19a3af94 esi=00000072 edi=19a170b8
eip=757ee081 esp=0078f268 ebp=0078f284 iopl=0         nv up ei pl nz ac pe nc
cs=0023  ss=002b  ds=002b  es=002b  fs=0053  gs=002b             efl=00000216
gdi32full!MRBDIB::vInit+0x78:
757ee081 e815560300      call    gdi32full!memcpy (7582369b)
0:000> dds esp L3
0078f268  19a17108
0078f26c  19a3af94
0078f270  00000072
0:000> dc eax
19a17108  c0c0c0c0 c0c0c0c0 c0c0c0c0 c0c0c0c0  ................
19a17118  c0c0c0c0 c0c0c0c0 c0c0c0c0 c0c0c0c0  ................
19a17128  c0c0c0c0 c0c0c0c0 c0c0c0c0 c0c0c0c0  ................
19a17138  c0c0c0c0 c0c0c0c0 c0c0c0c0 c0c0c0c0  ................
19a17148  c0c0c0c0 c0c0c0c0 c0c0c0c0 c0c0c0c0  ................
19a17158  c0c0c0c0 c0c0c0c0 c0c0c0c0 c0c0c0c0  ................
19a17168  c0c0c0c0 c0c0c0c0 c0c0c0c0 c0c0c0c0  ................
19a17178  00000000 c0c0c0c0 c0c0c0c0 c0c0c0c0  ................
0:000> dc edx
19a3af94  00000066 30303030 30303030 00200000  f...00000000.. .
19a3afa4  00000003 30303030 30303030 30303030  ....000000000000
19a3afb4  00000000 30303030 30303030 30303030  ....000000000000
19a3afc4  30303030 30303030 30303030 30303030  0000000000000000
19a3afd4  30303030 30303030 30303030 30303030  0000000000000000
19a3afe4  30303030 30303030 30303030 30303030  0000000000000000
19a3aff4  30303030 30303030 d0d0d0d0 ????????  00000000....????
19a3b004  ???????? ???????? ???????? ????????  ????????????????
Continuing the execution will lead us to a memcpy crash:
0:000> g
(1fc0.1c3c): Access violation - code c0000005 (first/second chance not available)
First chance exceptions are reported before any exception handling.
This exception may be expected and handled.
Time Travel Position: 2208:0
eax=00000012 ebx=00000000 ecx=00000001 edx=d0d0d0d0 esi=19a3b000 edi=19a17174
eip=76020b37 esp=0078f25c ebp=0078f284 iopl=0         nv up ei pl nz na po nc
cs=0023  ss=002b  ds=002b  es=002b  fs=0053  gs=002b             efl=00000202
ucrtbase!memcpy+0x507:
76020b37 8b16            mov     edx,dword ptr [esi]  ds:002b:19a3b000=????????
Triaging its exploitability
Now that we’ve analysed and understand the vulnerability we’ll move on to using different tools and techniques to determine which bytes within the WMF can the user control and how it impacts the code flow.
Identifying the memcpy source address and size
The first step is to try and identify whether we can influence both the source address and the memcpy size.
We’ll start with identifying the size (0x72) of the memcpy and running the initial crash case:
0:000> kv 2
 # ChildEBP RetAddr  Args to Child
00 0078f260 757ee086 19a17108 19a3af94 00000072 ucrtbase!memcpy+0x507 (FPO: [3,0,2])
01 0078f284 757edfd9 00000051 19a14d20 00003030 gdi32full!MRBDIB::vInit+0x7d (FPO: [Non-Fpo])
From the above stack trace, this value has been passed as a parameter which was calculated somewhere on the MRBDIB::vInit function.
Let’s unassemble backwards:
0:000> ub 757ee086
gdi32full!MRBDIB::vInit+0x66:
757ee06f 833a0c          cmp     dword ptr [edx],0Ch
757ee072 0f8419da0300    je      gdi32full!MRBDIB::vInit+0x3da88 (7582ba91)
757ee078 56              push    esi
757ee079 8d0439          lea     eax,[ecx+edi]
757ee07c 52              push    edx
757ee07d 50              push    eax
757ee07e 8945fc          mov     dword ptr [ebp-4],eax
757ee081 e815560300      call    gdi32full!memcpy (7582369b)
Travelling back in time before the crash gives us the following:
0:000> g- 757ee081
Time Travel Position: 21DD:31
eax=19a17108 ebx=00000000 ecx=00000050 edx=19a3af94 esi=00000072 edi=19a170b8
eip=757ee081 esp=0078f268 ebp=0078f284 iopl=0         nv up ei pl nz ac pe nc
cs=0023  ss=002b  ds=002b  es=002b  fs=0053  gs=002b             efl=00000216
gdi32full!MRBDIB::vInit+0x78:
757ee081 e815560300      call    gdi32full!memcpy (7582369b)

0:000> dds esp L3
0078f268  19a17108
0078f26c  19a3af94
0078f270  00000072
We are interested on the 72 value here. Travelling back in the beginning of the MF_AnyDIBits function reveals the following instruction:
gdi32full!MF_AnyDIBits+0x8b:
757edefd 8b55c8          mov     edx,dword ptr [ebp-38h] ss:002b:0078f300=00000072
eax=00000001 ebx=00000000 ecx=9f211284 edx=00000072 esi=19a3af94 edi=00000000
eip=757edf00 esp=0078f2d0 ebp=0078f338 iopl=0         nv up ei ng nz ac po cy
cs=0023  ss=002b  ds=002b  es=002b  fs=0053  gs=002b             efl=00000293
Let’s set a hardware breakpoint here:
0:000> ba w1 0078f300
We are interested to hit the breakpoint only when 1 byte is modified.
0:000> g-
Breakpoint 0 hit
Time Travel Position: 2152:3E0
eax=00000000 ebx=00000072 ecx=0078f300 edx=00000000 esi=19a3af94 edi=00000002
eip=757edd38 esp=0078f2a0 ebp=0078f2b0 iopl=0         nv up ei pl zr na pe nc
cs=0023  ss=002b  ds=002b  es=002b  fs=0053  gs=002b             efl=00000246
gdi32full!bMetaGetDIBInfo+0x10b:
757edd38 8b4d10          mov     ecx,dword ptr [ebp+10h] ss:002b:0078f2c0=0078f304
We hit the first breakpoint, now travelling back again a few instructions we’ll end up in the following snippet:
gdi32full!bMetaGetDIBInfo+0x15b:
757edd88 83c30c          add     ebx,0Ch
eax=00000020 ebx=00000066 ecx=00000010 edx=00000020 esi=19a3af94 edi=00000002
eip=757edd86 esp=0078f2a0 ebp=0078f2b0 iopl=0         nv up ei pl zr na pe nc
cs=0023  ss=002b  ds=002b  es=002b  fs=0053  gs=002b             efl=00000246
0:000> dc esi
19a3af94  00000066 30303030 30303030 00200000  f...00000000.. .
19a3afa4  00000003 30303030 30303030 30303030  ....000000000000
19a3afb4  00000000 30303030 30303030 30303030  ....000000000000
19a3afc4  30303030 30303030 30303030 30303030  0000000000000000
19a3afd4  30303030 30303030 30303030 30303030  0000000000000000
19a3afe4  30303030 30303030 30303030 30303030  0000000000000000
19a3aff4  30303030 30303030 d0d0d0d0 ????????  00000000....????
19a3b004  ???????? ???????? ???????? ????????  ????????????????
Aha! So ebx which is 0x66, is being added with 0x0C and it turns out this address actually points to the lpbmi BITMAPINFOHEADER we examined previously! Stepping into one instruction we’ll see the result 0x72 on ebx which will later be used for the memcpy.
0:000> p
Time Travel Position: 2152:354
eax=00000020 ebx=00000072 ecx=00000010 edx=00000020 esi=19a3af94 edi=00000002
eip=757edd8b esp=0078f2a0 ebp=0078f2b0 iopl=0         nv up ei pl nz ac pe nc
cs=0023  ss=002b  ds=002b  es=002b  fs=0053  gs=002b             efl=00000216
gdi32full!bMetaGetDIBInfo+0x15e:
757edd8b 8b4610          mov     eax,dword ptr [esi+10h] ds:002b:19a3afa4=00000003
Now that we have a basic understanding how the memcpy size was calculated, let’s run the following python script which it’s going to mutate that byte and create 255 different files; from 0x00 to 0xff:
"""
Snippet taken from http://code.activestate.com/recipes/510399-byte-to-hex-and-hex-to-byte-string-conversion/
"""
def HexToByte( hexStr ):
    bytes = []

    hexStr = ''.join( hexStr.split(" ") )

    for i in range(0, len(hexStr), 2):
        bytes.append( chr( int (hexStr[i:i+2], 16 ) ) )

    return ''.join( bytes )

if __name__ == "__main__":

    original_crasher = "C:\\Users\\ida\\Desktop\\0dvulns\\BugAnalysis\\memcpy_value\\crasher_MIN.wmf"

    for i in xrange(256):
        hex_format = hex(i)[2:].zfill(2)

        print "[*] Opening original file.."
        f=open(original_crasher,"rb")
        s=f.read()
        f.close()
        print "[+] Mutating nSize byte with: %s" % hex_format
        s=s.replace(b'f',HexToByte(hex_format))

        filename_to_save = 'crasher_%s.wmf' % str(hex_format)
        bitout = open(filename_to_save,'wb')

        print "[*] Saving crasher_memcpy_%s.wmf" % hex_format
        bitout.write(s)
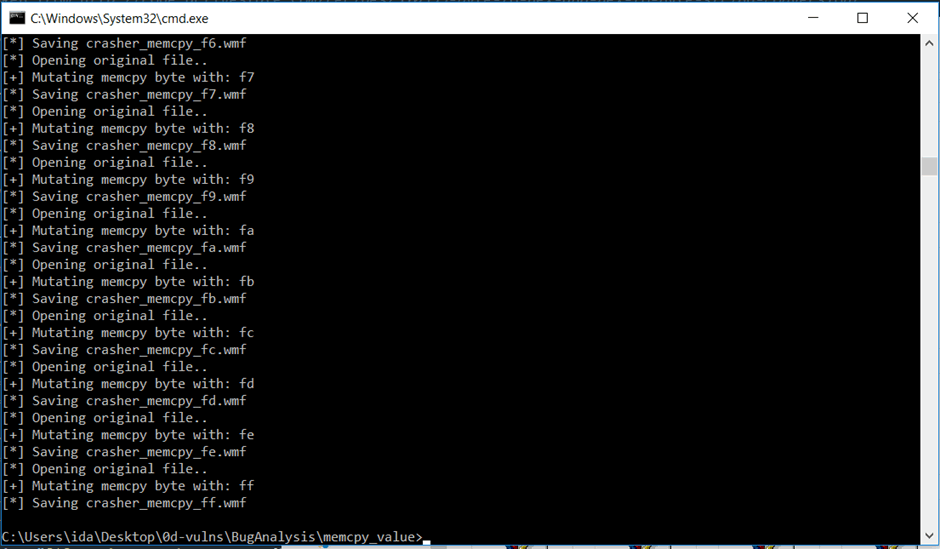
Figure 12: Modifying the memcpy() size variable.
Finally, we are going to use the following simple debug harness to determine which files do crash our harness:
#!/bin/env python
# -*- coding: utf-8 -*-

# Copyright (c) 2009-2018, Mario Vilas
# All rights reserved.
#
# Redistribution and use in source and binary forms, with or without
# modification, are permitted provided that the following conditions are met:
#
#     * Redistributions of source code must retain the above copyright notice,
#       this list of conditions and the following disclaimer.
#     * Redistributions in binary form must reproduce the above copyright
#       notice,this list of conditions and the following disclaimer in the
#       documentation and/or other materials provided with the distribution.
#     * Neither the name of the copyright holder nor the names of its
#       contributors may be used to endorse or promote products derived from
#       this software without specific prior written permission.
#
# THIS SOFTWARE IS PROVIDED BY THE COPYRIGHT HOLDERS AND CONTRIBUTORS "AS IS"
# AND ANY EXPRESS OR IMPLIED WARRANTIES, INCLUDING, BUT NOT LIMITED TO, THE
# IMPLIED WARRANTIES OF MERCHANTABILITY AND FITNESS FOR A PARTICULAR PURPOSE
# ARE DISCLAIMED. IN NO EVENT SHALL THE COPYRIGHT OWNER OR CONTRIBUTORS BE
# LIABLE FOR ANY DIRECT, INDIRECT, INCIDENTAL, SPECIAL, EXEMPLARY, OR
# CONSEQUENTIAL DAMAGES (INCLUDING, BUT NOT LIMITED TO, PROCUREMENT OF
# SUBSTITUTE GOODS OR SERVICES; LOSS OF USE, DATA, OR PROFITS; OR BUSINESS
# INTERRUPTION) HOWEVER CAUSED AND ON ANY THEORY OF LIABILITY, WHETHER IN
# CONTRACT, STRICT LIABILITY, OR TORT (INCLUDING NEGLIGENCE OR OTHERWISE)
# ARISING IN ANY WAY OUT OF THE USE OF THIS SOFTWARE, EVEN IF ADVISED OF THE
# POSSIBILITY OF SUCH DAMAGE.

from sys import exit
from winappdbg import win32, Debug, HexDump, Crash
import glob
from time import sleep

def my_event_handler( event ):

    # Get the event name.
    name = event.get_event_name()

    # Get the event code.
    code = event.get_event_code()

    # Get the process ID where the event occured.
    pid = event.get_pid()

    # Get the thread ID where the event occured.
    tid = event.get_tid()

    # Get the value of EIP at the thread.
    pc = event.get_thread().get_pc()

    # If the event is a crash...
    if code == win32.EXCEPTION_DEBUG_EVENT and event.is_last_chance():
        print "Crash detected, storing crash dump in database..."

        # Generate a minimal crash dump.
        crash = Crash( event )

        # You can turn it into a full crash dump (recommended).
        crash.fetch_extra_data( event, takeMemorySnapshot = 1 ) # full memory dump

        print crash
        event.get_process().kill()

def simple_debugger( argv ):

    # Instance a Debug object, passing it the event handler callback.
    debug = Debug( my_event_handler, bKillOnExit = True )
    try:
        # Start a new process for debugging.
        debug.execv( argv )
        # Wait for the debugee to finish.
        debug.loop()
    # Stop the debugger.
    finally:
        debug.stop()

if __name__ == "__main__":

    harness = "C:\\Users\\ida\\Desktop\\0d-vulns\\GDI\\GdiRefactor.exe"

    wmf_files = list(glob.glob('C:\\Users\\ida\\Desktop\\0d-vulns\\BugAnalysis\\memcpy_value\\*.wmf'))
    for file in wmf_files:
        print "[*] Trying to crash the harness with: %s" % file

        argv = [harness, file]
        simple_debugger(argv)

        sleep(0.2)
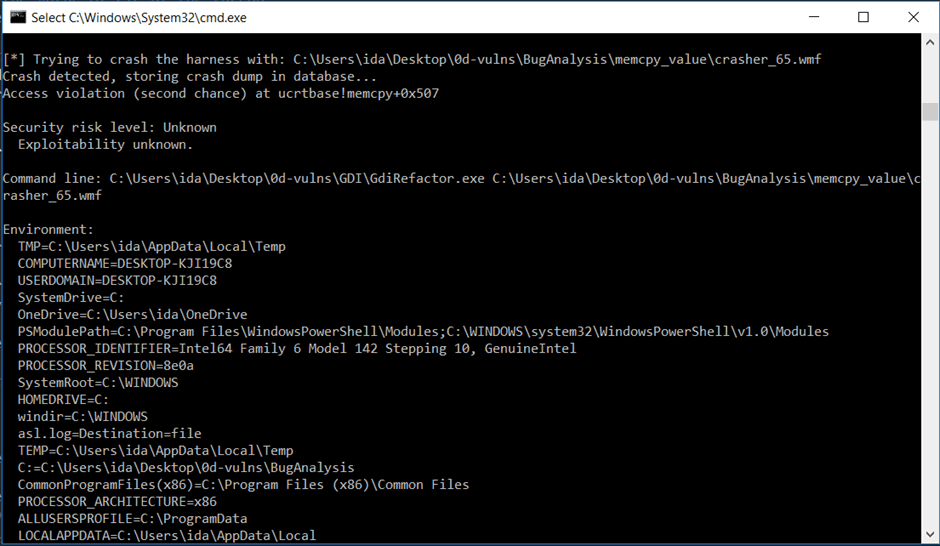
Figure 13: Running the simple debug script to detect any different crashes of the newly modified seed files.
After running the above script, it turns out that any value from 0x61 – 0x68 will crash the harness.
Running the new test case crasher_68.wmf and from the previous analysis we expect the size of memcpy to be 0x74:
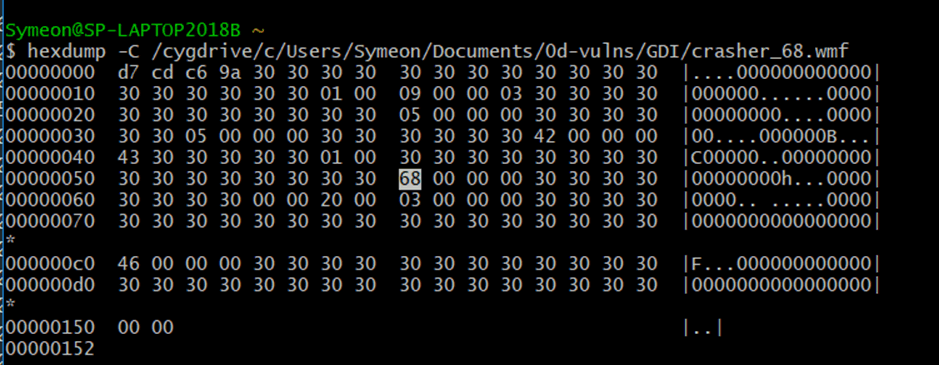
Figure 14: Hex dump view of the new crasher file.
0:000> ?68+c
Evaluate expression: 116 = 00000074
And running it under the debugger:
gdi32full!MRBDIB::vInit+0x78:
76d6e081 e815560300      call    gdi32full!memcpy (76da369b)
0:000> dds esp L3
0118f530  08a1c108
0118f534  08a3bf94
0118f538  00000074
which gives us the same memory dump as the original crasher:
0:000> g
(2008.1f7c): Access violation - code c0000005 (!!! second chance !!!)
eax=00000014 ebx=00000000 ecx=00000002 edx=d0d0d0d0 esi=08a3c000 edi=08a1c174
eip=08260b37 esp=0118f524 ebp=0118f54c iopl=0         nv up ei pl nz na po nc
cs=0023  ss=002b  ds=002b  es=002b  fs=0053  gs=002b             efl=00010202
ucrtbase_8210000!memcpy+0x507:
08260b37 8b16            mov     edx,dword ptr [esi]  ds:002b:08a3c000=????????
Understanding the source address
For the last part of the analysis we are going to understand how the source address is calculated and modify those bytes as well! I will be restarting the trace (!tt 00) and then once the crash occurs I’ll go back to the memcpy:
0:000> g- 757ee081
Time Travel Position: 21DD:31
eax=19a17108 ebx=00000000 ecx=00000050 edx=19a3af94 esi=00000072 edi=19a170b8
eip=757ee081 esp=0078f268 ebp=0078f284 iopl=0         nv up ei pl nz ac pe nc
cs=0023  ss=002b  ds=002b  es=002b  fs=0053  gs=002b             efl=00000216
gdi32full!MRBDIB::vInit+0x78:
757ee081 e815560300      call    gdi32full!memcpy (7582369b)
0:000> dds esp L3
0078f268  19a17108 <== destination
0078f26c  19a3af94 <== source
0078f270  00000072
Now let’s step back 4 instructions:
0:000> p- 4
-- redacted --
eax=000000c4 ebx=00000000 ecx=00000050 edx=19a3af94 esi=00000072 edi=19a170b8
eip=757ee079 esp=0078f270 ebp=0078f284 iopl=0         nv up ei pl nz ac pe nc
cs=0023  ss=002b  ds=002b  es=002b  fs=0053  gs=002b             efl=00000216
gdi32full!MRBDIB::vInit+0x70:
757ee079 8d0439          lea     eax,[ecx+edi]
On the output above, edi is added to ecx, so:
0:000> ?ecx+edi
Evaluate expression: 430010632 = 19a17108
However, where did that 0x50 (ecx) come from? Stepping back a few commands we end up on the following instruction:
eax=00000051 ebx=00000072 ecx=25b4115e edx=00000000 esi=00000072 edi=19a170b8
eip=757ee022 esp=0078f274 ebp=0078f284 iopl=0         nv up ei pl zr na pe nc
cs=0023  ss=002b  ds=002b  es=002b  fs=0053  gs=002b             efl=00000246
gdi32full!MRBDIB::vInit+0x19:
757ee022 8b4d28          mov     ecx,dword ptr [ebp+28h] ss:002b:0078f2ac=00000050
Let’s set another hardware breakpoint here:
0:000> ba w1 0078f2ac
…and travelling backwards we end up on the following snippet:
   gdi32full!MRBDIB::vInit:
757ee009 8bff           mov     edi, edi
757ee00b 55             push    ebp
757ee00c 8bec           mov     ebp, esp
757ee00e 51             push    ecx
757ee00f 53             push    ebx
So, it could be a PUSH instruction from before the call modified it, let’s print all the arguments before the MRBDIB::vInit call:
So it could be a PUSH instruction from before this call modified it, let’s print all the arguments before the MRBDIB::vInit call:
Breakpoint 1 hit
Time Travel Position: 2152:4D3
eax=00003030 ebx=00000072 ecx=19a170b8 edx=19a170b8 esi=19a14d20 edi=00000000
eip=757ee00f esp=0078f280 ebp=0078f284 iopl=0         nv up ei pl nz na pe nc
cs=0023  ss=002b  ds=002b  es=002b  fs=0053  gs=002b             efl=00000206
gdi32full!MRBDIB::vInit+0x6:
757ee00f 53              push    ebx
…and let’s travel back once again:
0:000> g-
Breakpoint 2 hit
Time Travel Position: 2152:4C6
eax=00003030 ebx=00000072 ecx=19a170b8 edx=19a170b8 esi=19a14d20 edi=00000000
eip=757edfc1 esp=0078f2ac ebp=0078f338 iopl=0         nv up ei pl nz na pe nc
cs=0023  ss=002b  ds=002b  es=002b  fs=0053  gs=002b             efl=00000206
gdi32full!MF_AnyDIBits+0x14f:
757edfc1 ff7520          push    dword ptr [ebp+20h]  ss:002b:0078f358=00003030
The instructions are the following:
== redacted ==
757edfbe 53             push    ebx
757edfbf 6a50           push    50h
757edfc1 ff7520         push    dword ptr [ebp+20h]  ss:002b:0078f358=00003030 ; eip is here
Let’s print the contents of 0078f2ac:
0:000> dc 0078f2ac L1
0078f2ac  00000050                             P...
And go backwards one command:
0:000> p-
Time Travel Position: 2152:4C5
eax=00003030 ebx=00000072 ecx=19a170b8 edx=19a170b8 esi=19a14d20 edi=00000000
eip=757edfbf esp=0078f2b0 ebp=0078f338 iopl=0         nv up ei pl nz na pe nc
cs=0023  ss=002b  ds=002b  es=002b  fs=0053  gs=002b             efl=00000206
gdi32full!MF_AnyDIBits+0x14d:
757edfbf 6a50            push    50h

0:000> dc 0078f2ac L1
0078f2ac  00000000                             ....
As you can see above, that value is indeed fixed, and in fact, going back from vInit function this is the offBmiSrc/offBitsInfoDib1 argument which is not controllable at all.
We continued with the same process regarding the heap size allocation of the source address which however didn’t give us any interesting results. Unfortunately, other than leaking bytes we were not able to fully turn this bug into a PoC that leaks heap addresses. It should be noted though that it might be possible to achieve that on a scripted environment (such as trigger the bug inside Internet Explorer/Edge).
Patch
By diffing September’s gdi32full.dll (v. 10.0.16299.492) with the patched one (v. 10.0.17134.345), the following functions seems to have been patched:
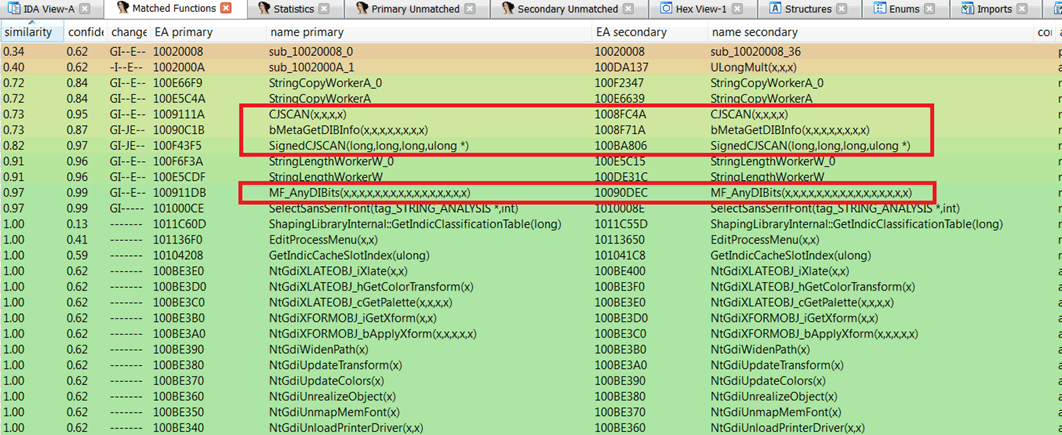
Interestingly enough, we see that at least 4 functions were modified, and in fact by setting breakpoints to those functions we were able to hit them.
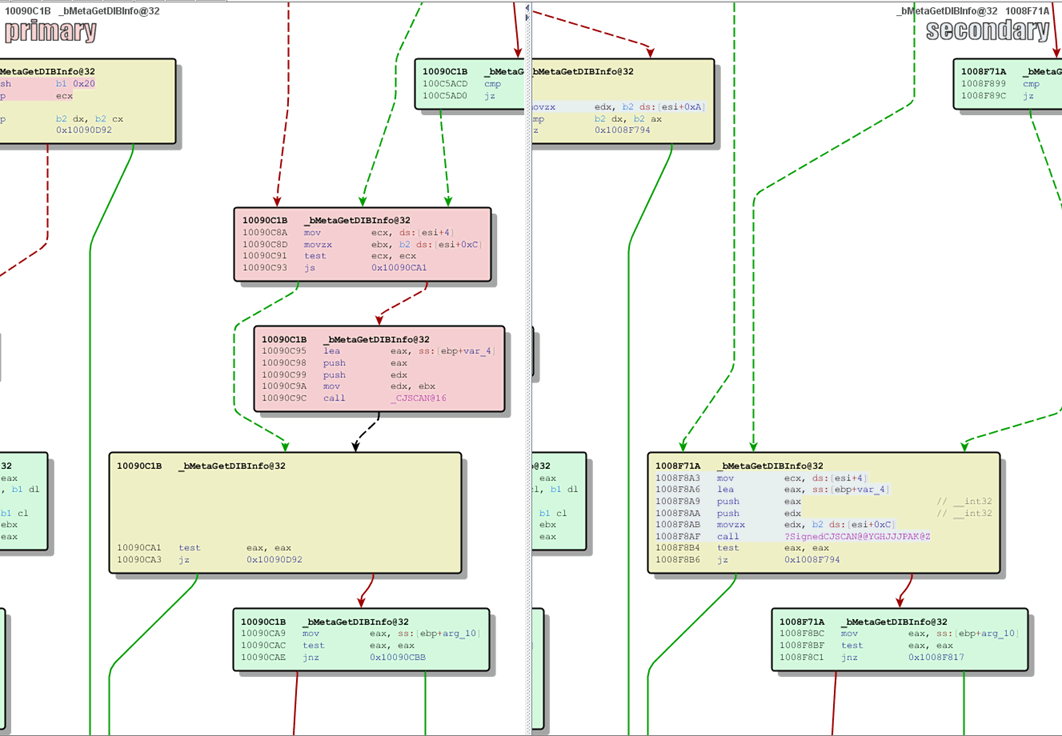
Figure 15: Improved checks within the bMetaGetDIBInfo
The above screenshots depicts some improved calls to CJSCAN within the bMetaGetDIBInfo methods amongst many other code changes.
Conclusion
Identifying the root cause of a bug and speculating its exploitability can be time consuming and tedious process, yet with the help of windbg’s TTD features we certainly were able to speed up this process and make it more pleasant!
