Take-off Performance Part 1: Introduction, Thrust & Speeds
TL;DR
- Take-off performance applications perform calculations to provide critical take-off performance data to pilots (e.g. thrust/trim/flap setting for take-off)
- Modifying any one of these could have severe consequences. For example, an aircraft going off the end of a runway or the inability of that aircraft to outclimb terrain or obstacles beyond the end of the runway – both due to insufficient thrust being applied on take-off
- To assess risk we used licenced commercial pilots in our simulator having made various modifications to our own take-off performance application installed on an EFB
Introduction
Previous blog updates discussed EFBs in general. Their integrity, susceptibility to misconfigured (or manipulated) updates, and the human factors considerations are all applicable to EFBs as a whole.
In this update we will be discussing the potential outcomes of tampering specifically with take-off performance applications. When assessing the risks, PTP used licenced airline pilots in our commercial aircraft simulator. We performed various modifications to a take-off performance application installed on an EFB, the pilots then carried out their tasks as if they were on a commercial flight – including completing any applicable cross-checks. This ensured our assessment was accurate and enabled us to determine if there are any weaknesses as well as to consider what improvements could be made.
Take-off Performance
Before pilots attempt to take-off from a runway they need to perform various calculations to obtain important information regarding that particular take-off. Is the aircraft weight acceptable for this runway? Is the friction coefficient going to be an issue (a wet runway will result in a longer take-off run compared to a dry runway)?
A whole host of considerations and calculations are made and the pilots either assess the performance as acceptable or deem it inappropriate and either don’t take-off or change the conditions (e.g. offload freight or chose a longer runway) to ensure the take-off is safe. Additionally, airlines like to minimise fuel usage and engine wear to reduce costs. With this in mind, pilots don’t use full power/thrust when taking off but instead calculate a reduced amount of thrust that is safe to use for that given runway. This reduced thrust amount is known as a “Derate” or “Flex” depending on aircraft type.
There are various other items that need to be calculated (for example V speeds, flap settings and trim settings) with each item forming part of what is known as the “critical data”. Each item has a variety of factors ranging from aircraft weight, weather conditions for departure (temperature/wind conditions), runway length, terrain proximity once airborne, and so on. Pilots obtain the required information from a variety of sources and once all the required information has been obtained the pilots will calculate their “critical data” for take-off performance.
The method of calculating the take-off performance data was traditionally by consulting a paper aircraft performance manual, locating the correct table and then applying the relevant factors. Much of the required data has to be applied to different pages of the manual and therefore this method is cumbersome and is prone to errors. It is becoming increasingly common now for pilots to use EFB applications to calculate their take-off performance.
Doing so speeds up the process of calculating the data and provides a more accurate result (thus saving cost with reduced fuel/engine wear). Airlines that don’t yet utilise an EFB for take-off performance calculation on the whole still use the paper manual/table method.
In most EFB’s the performance is calculated by the pilots using a Take-off Performance application, the output is then displayed to the pilots. Care must be taken when inputting the data as the consequences of incorrect data being used have long been documented and sadly there have been many accidents over the years with the cause being attributable to the incorrect calculation of take-off performance.
A simple typing error could result in a variety of outcomes such as an aircraft overrunning the end of the runway on take-off resulting in a complete hull loss. Therefore, pilots are trained rigorously to input the data with care. “Garbage in, garbage out” is the concept that flawed, or nonsense input data produces nonsense output or “garbage”. In the take-off performance case this is very relevant.
What pilots would be less mindful of is if the application was using incorrect data despite the data entry being correct. Most of the EFB performance applications compute the data locally as the aircraft (therefore the EFB) could be anywhere in the world and signal/coverage is not always guaranteed. As a result, databases located on the EFB contain all of the criteria and parameters. Tampering with these databases could vary the output of the application, with potentially catastrophic consequences.
To an extent the risk is mitigated by the crosschecking of data by the pilots, however the emphasis on the crosscheck is that the pilots confirm the parameters entered into the performance application are correct and that the FMS/FMC entered data matches that which was computed by the performance application. As a result, it could be said that a malicious hacker would need to tamper with two EFBs rather than one as it is possible both pilots would compute the performance separately.
This is not always done effectively however (as the examples below show), and it is not uncommon for the take-off performance crosscheck to be done on the very same device (application open, crosschecking pilot confirms data entry is correct).
Many airlines don’t mandate that the crosscheck is performed on a separate device. In fact it is perfectly acceptable to have one EFB failed (broken or unusable) for a specified time and some airlines only have one EFB on the aircraft for calculating the take-off performance. It is therefore conceivable that an EFB take-off performance application that had been tampered with would not be highlighted by any crosschecking as it’s often likely the calculation was performed using just one EFB.
In 2014, a Qantas 737 experienced a tail strike on take-off from Sydney airport. The Australian Transport Safety Bureau (ATSB) concluded the cause of the strike was due to the First Officer entering an incorrect weight into his EFB (an Apple iPad). Instead of entering the correct take-off weight of 76,400kg, he entered 66,400kg. The error was not detected by the Captain. As a result the take-off rotation speed (Vr) was calculated as 10kts slower than required for the actual take-off weight, which was sufficient to cause a tail strike on rotation.
Whilst in this instance the consequences were minor (slight damage to the tail – only detected after landing at destination), tail strikes can be very dangerous. In 1985 a Japan Airlines 747 suffered an explosive decompression resulting in 520 fatalities. The cause of the accident was the improper repair of a tail strike that had occurred previously.
Targets and potential data access/tampering consequences
Target: DERATE/FLEX
Take-off is generally performed using the minimum thrust possible. The “Derate” or “Flex” (aircraft type specific) reduces the rated thrust of the engines to either a prespecified value or by a selectable percentage of the normal rated thrust. Reducing the amount of thrust used for take-off enables airlines to reduce fuel burn and engine wear, thus reducing cost. The maximum reduction is usually 25%, i.e. the take-off must be performed with at least 75% of the full rated thrust for the engines.
Pilots calculate the Derate/Flex prior to each departure and input the setting into the FMS/FMC prior to pushback. When on the runway and ready to take-off, pressing the TOGA buttons or setting the thrust levers into the FLX detent commands the auto throttle to set the pre-calculated take-off thrust setting that was entered into the FMS/FMC.
Take-off thrust derived from EFB application inserted into FMC
Runway excursion risk
In simple terms this is when there is insufficient runway left to accelerate to Vr (the speed at which pilots “rotate” the aircraft to start climbing) as not enough thrust has been If pilots tried to rotate early this could cause a tail strike and potential stall. The derate/flex could be manipulated directly or alternatively the factors which affect the thrust setting could be modified.
In 2019 an A320 crew in Lisbon calculated their take-off performance using incorrect data on an EFB. In this incident, the crew computed their performance based on starting the take-off from the very beginning of the runway, when their intention had been to calculate performance for an intersection take-off. The Captain had no access to an EFB once the aircraft was taxying as his EFB was not useable due to an inoperative EFB cradle. As a result, the pilots used a lower thrust setting than was required resulting in the aircraft lifting off 110m from the runway end (or, at take-off speed, 1.3 seconds before reaching the end of the runway).
The quantity of possible performance corrections which could be modified is almost endless. Some other examples include the modification of:
- Aircraft take-off weight (suggesting the aircraft is lighter than it is)
- Temperature effect on thrust setting(warmer air temperatures require higher thrust settings as the air density is lower thus reducing the efficiency/power of engines)
- Wind effect on thrust setting (a headwind reduces the runway required as it increases the airflow over the wings – tailwinds increase the runway required)
- Barometric pressure on thrust setting (lower air pressureresults in lower efficiency/engine thrust)
- Runway condition, aircraft acceleration performance and profile (pilots assess runway condition and apply correctionsto thrust settings to account for reduced friction between the tyres and the runway, e.g. a snow covered runway will result in slower acceleration vs a dry runway)
- Aircraft deficiency corrections (aircraft regularly fly with deficiencies/inoperative components, some deficiencies affect take-off performance calculations e.g. stopping performance with one wheel brake or one spoiler inoperative)
As the quantity of performance corrections is almost endless, the following example (images 1 & 2 below) demonstrates just one of the corrections PTP was able to modify on the EFB application.
The runway condition will affect the acceleration of the aircraft. Just like cars, aeroplane tyres are affected by the condition of the surface they sit on. A wet runway for a given thrust setting would have a longer take-off run than on the same runway if it were dry. This acceleration is significantly affected when snow/ice are present and in some cases the take-off run can be more than doubled.
When calculating the performance, pilots select the runway condition from a list. This selection automatically applies a factor to the take-off performance calculation. We were able to both modify and suppress the effect of runway conditions on the calculation. Whilst this example shows the risks with the runway condition, the threat is present with all the items listed above. Suppression or manipulation of the effect of any of these items could cause an aircraft to overrun the runway.
Why wouldn’t the pilots notice the factor hadn’t been applied? Quite simply because the application shows that it HAS been applied since the runway condition has been selected. By choosing the runway condition, the assumption is that the calculation will be correct.
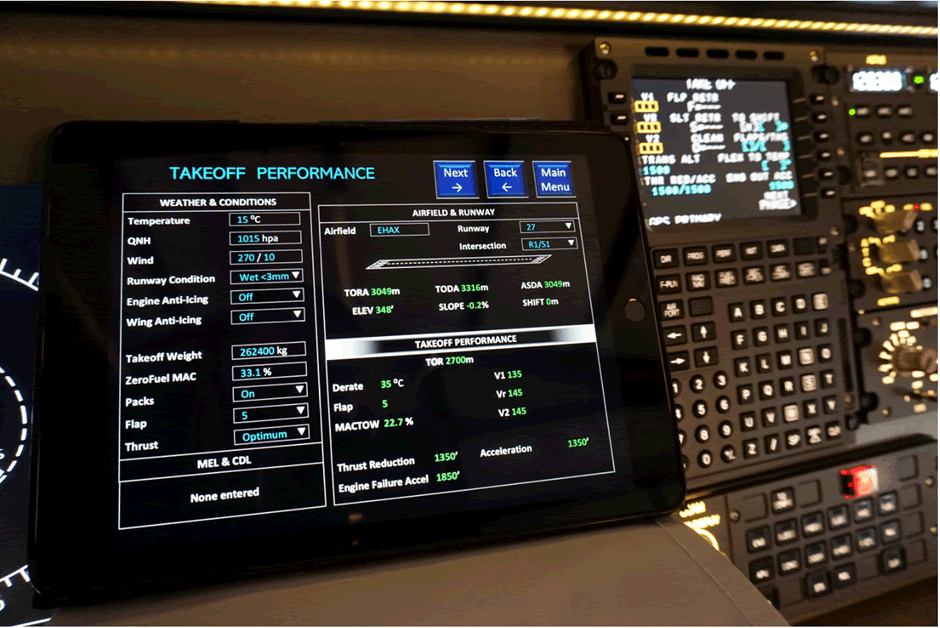
Calculation 1 (below) contains a take-off performance calculation for a dry runway.
We wrote our own EFB performance app to illustrate the potential challenges.
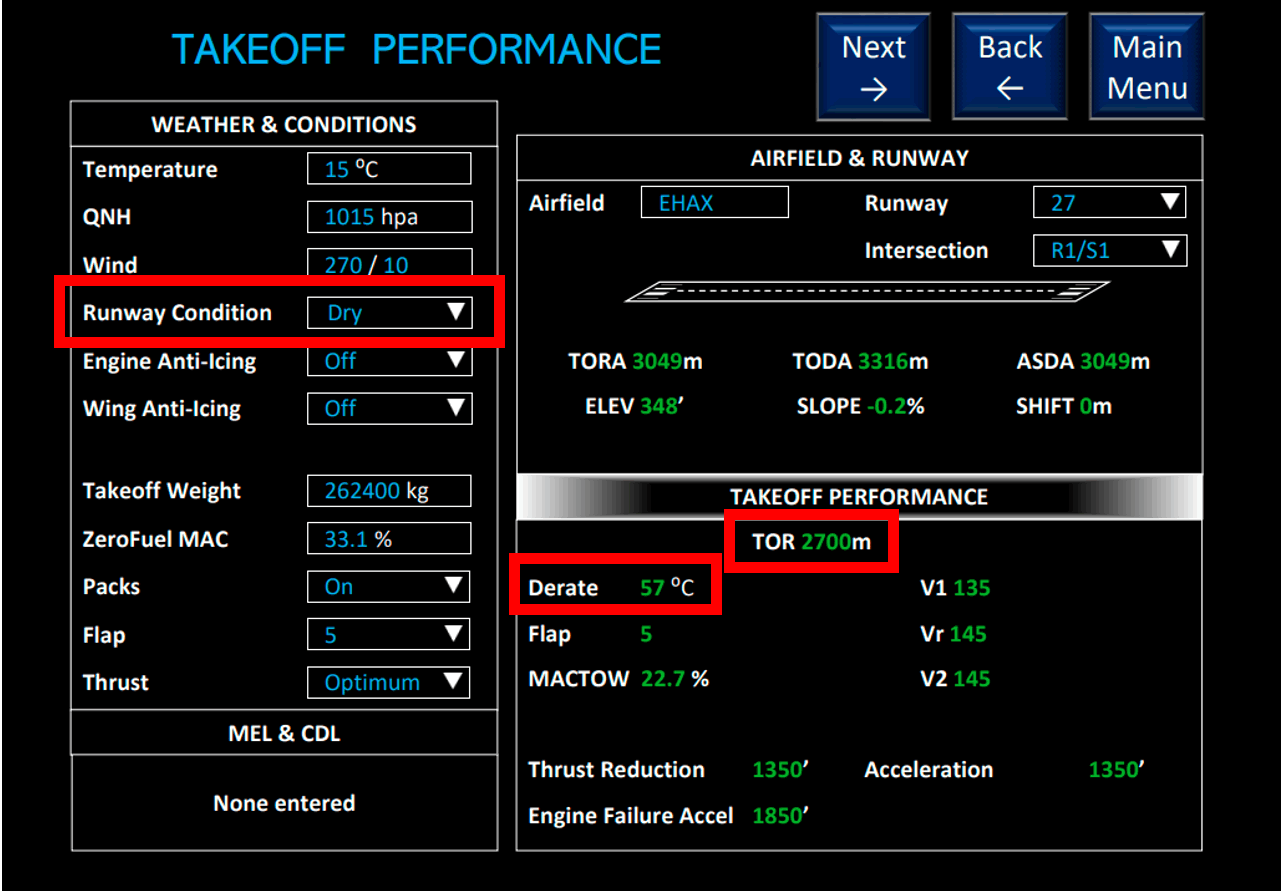
Image 1. Calculation for a dry runway, Derate 35⁰ with TOR 2700m
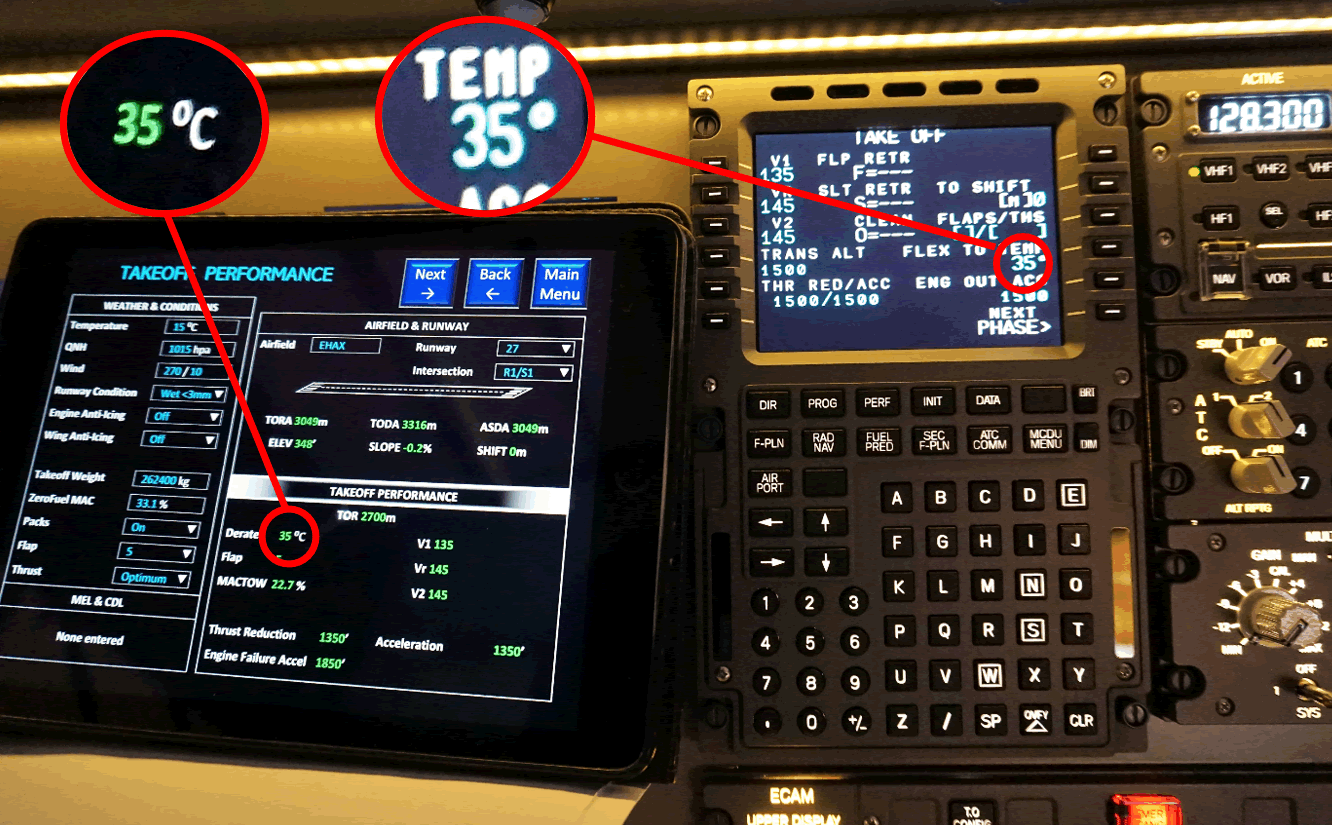
Having changed the runway condition to 5mm of Ice (see Image 2 below), the performance application produced a Derate of 15⁰ and a TOR of 3600m. Having supressed the effect of ice on the runway, the produced calculation matched that of a dry runway – i.e. not enough thrust and 900m shorter take-off run than that which is true.
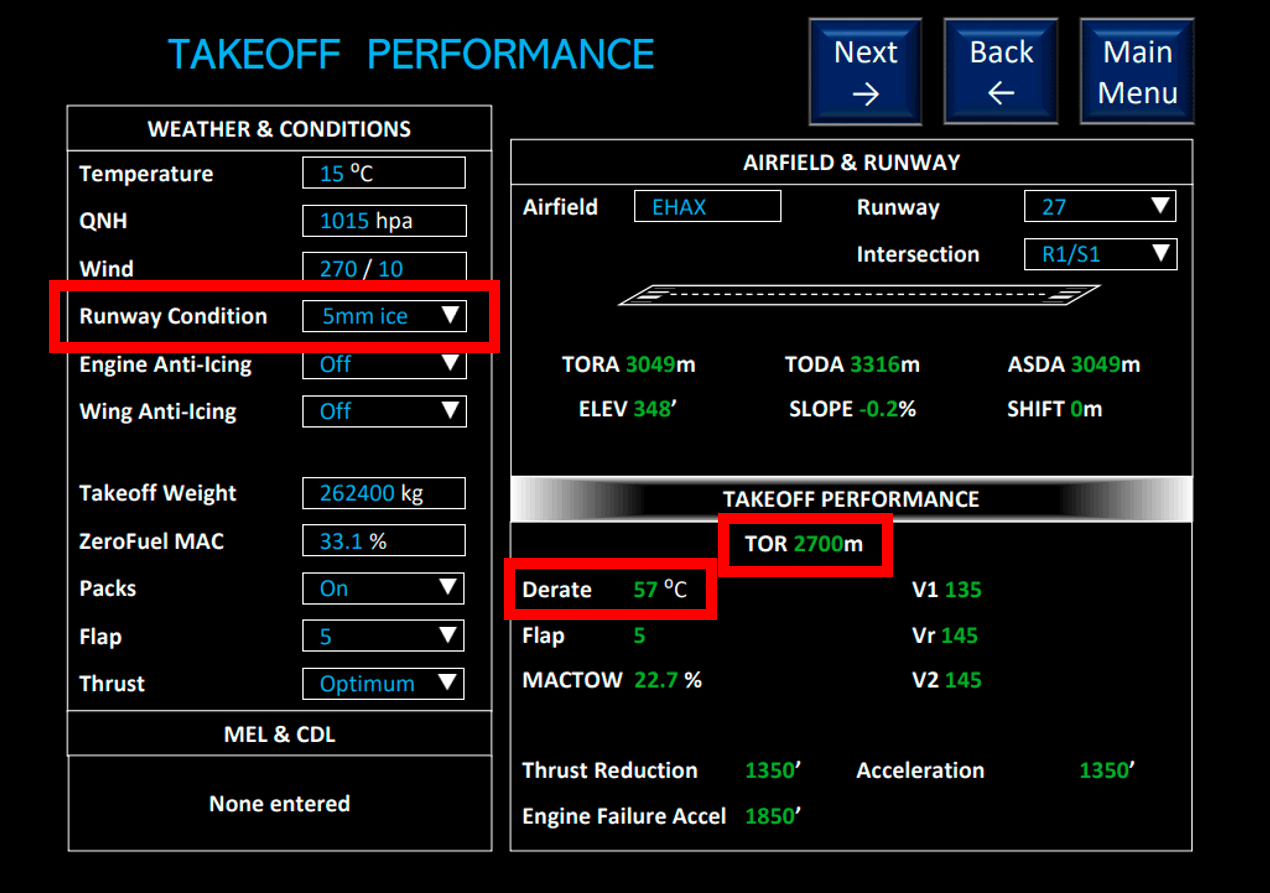
Image 2. Incorrect Derate produced (correct is 15⁰) and TOR is 900m short (unchanged)
Incidents/accidents
MK Airlines 747 at YHZ in 2004, utilised Laptop Tool to calculate take-off performance using the incorrect take-off weight resulting in crash:
Report: https://www.tsb.gc.ca/eng/rapports-reports/aviation/2004/a04h0004/a04h0004.html – see section 1.18.1 for information on the Laptop Tool
Blue Air 737 at BHX in 2018, pilots used an Electronic Flight Bag to calculate take-off performance but incorrectly entered the zero fuel weight instead of the take-off During the take-off the aircraft suffered a tail strike.
Emirates A340 at DXB in 2009, incorrect take-off weight entered into the Electronic Flight Bag to calculate take-off performance resulting in tail strike and runway excursion:
Report: https://reports.aviation-safety.net/2009/20090320-0_A345_A6-ERG.pdf – see section 2.3 for information on the EFB)
A319 at NCE in 2007, inadvertent miscalculation of take-off performance by selecting an incorrect intersection as the departure point resulting in a lower than required thrust setting. Note from report: “While entering the data independently into their electronic flight bags (EFB), both inadvertently selected intersection with taxiway Q3”
Note from report: This incident resulted from identical independent errors not being trapped by a TORA cross-check or by EFB output validation. While revised software with a graphical runway presentation could have helped reduce the likelihood of this occurrence. Automated systems, such as TOS2, could, in the future, provide an effective barrier to incidents of this nature.
Belair A320 at OPO in 2013, aircraft take-off performed from a runway intersection when the crew had used EFB to calculate take-off performance from the full runway length. Note from report: “crew must execute the take-off performance calculation on an electronic flight bag (EFB). Both pilots have an EFB for this purpose.”
Report: https://www.skybrary.aero/bookshelf/books/3551.pdf
A320 at LTN in 2008, utilised a thrust setting only valid for take-off from the runway full length – a take-off from an intersection was performed resulting in the aircraft becoming airborne 180m from runway end:
Other recent notable incidents/accidents caused by the miscalculation of take-off performance:
| Date | Aircraft type/airline | Report | Description |
| 03/2018 | 787 El Al | AAII Israel 33/08 | Incorrect take-off weight used |
| 05/2015 | 777 Air France | BEA F-GUOC report | EFB data entry error |
| 09/2014 | 737 Transavia | DSB | EFB data entry error |
| 07/2013 | 777 KLM | DSB | EFB data entry error |
Unassured terrain clearance. Take-off performance calculations ensure aircraft clear terrain and obstacles. The minimum screen height is 35 feet with a minimum speed of V2 (reduced to 15 feet on a wet runway). With an incorrect thrust setting terrain/obstacle clearance would not be assured – i.e. the climb performance/gradient may not be sufficient to avoid the terrain as the engine thrust is insufficient. The obstacle/terrain clearance height calculations are generally based on the aircraft clearing the highest obstacle in close proximity to the planned take-off
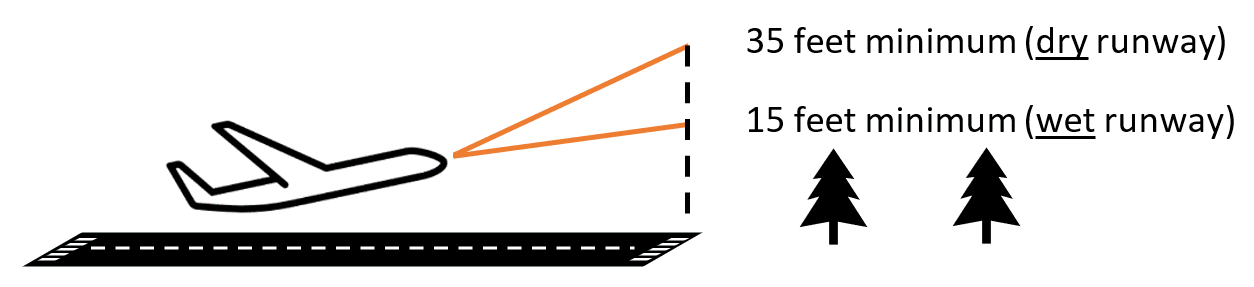
Minimum screen height on take-off
Increased engine wear & fuel burn.A subtle change to the derate/flex which increases (instead of decreases) the take-off thrust could go unnoticed for some time. This would result in increased cost to the airline through the additional (and unnecessary) fuel burn as well as increased engine wear. If the issue were to be replicated over an entire fleet (or in extremis an entire airline) then collectively the cost could be significant. Many performance applications allow for invisible factors to be applied behind the scenes, these factors could be modified with the pilots being totally un
Target: V SPEEDS
V speeds are speeds which are used to define airspeeds that are important or useful to the operation of an aircraft. Some of these speeds are fixed/non-modifiable and are not calculated for each departure. Others (V1/Vr/V2 and VMCA/VMCG) are calculated and reviewed by the pilots for every take-off. As with the Derate/Flex, the V Speeds are generally calculated by the pilots on the EFB and then entered into the FMS prior to departure.
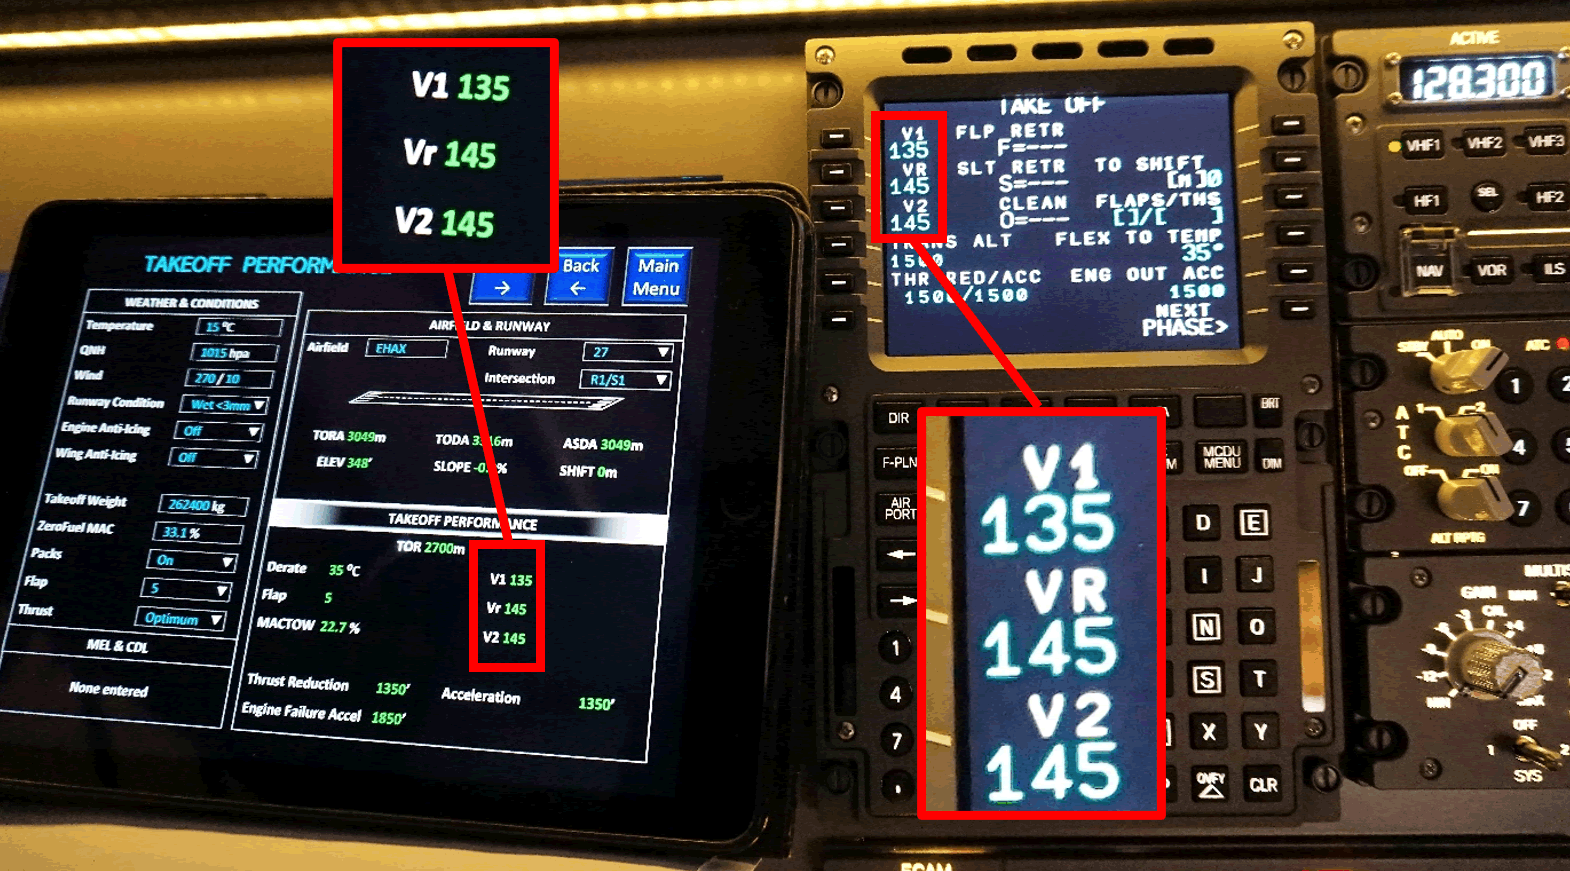
V Speeds derived from EFB, entered into FMC
Critical Take-off V Speeds Explained
V1: The maximum speed at which a take-off could be rejected/aborted. Rejecting/stopping from above this speed can result in the aircraft overrunning the end of the runway. This speed is variable and is very dependent on the conditions on the day (weather, runway condition, aircraft weight, thrust used etc.)
Vr: The speed at which rotation of the aircraft is performed. At this speed the pilot will apply control inputs to raise the nose of the aircraft and establish the aircraft in a climb.
V2: The minimum speed at which the aircraft could fly safely having had one engine fail whilst meeting the minimum criteria for clearing terrain/obstacles. Flying below V2 with a failed engine can result in the aircraft having to descend in order to accelerate above V2 (not really possible on take-off, hence pilots regularly train for engines failures on take-off as accurate control is critical). Additionally, as V2 is always at least equal to if not above VMCA, a reduction below V2 could result in the aircraft flying below VMCA.
VMCA: The minimum speed at which directional control can be maintained in the air with one engine inoperative. Attempting to fly the aircraft below this speed with a failed engine could result a lack of control due to the airspeed over the control surfaces (in particular the rudder) being insufficient (i.e. the aircraft would turn towards the failed engine even with full opposite rudder – bank would be required to maintain direction for a given thrust setting resulting in poorer climb performance).
VMCG: The minimum speed at which directional control can be maintained on the runway with one engine failed and the other engine/s at take-off thrust. If an engine fails on take-off, the pilots will not necessarily abort/reject. If the aircraft is already travelling quickly (above V1) then the take-off will be continued and the pilots apply rudder enabling them to maintain the centreline of the runway and subsequently climb with directional control.
Because a certain amount of airflow over the rudder is needed for this directional control, at slower speeds the airflow is not sufficient to maintain directional control and the only way of not going off the side of the runway is by closing the thrust (rejecting the take-off). If the performance data is correct, VMCG must always be less than V1 because if it were higher then an engine failure could result in the aircraft going off the side of the runway but being unable to stop as it is above V1 (i.e. too fast to reject the take-off).
Stall/low speed/tail strike risk: If Vr and/or V2 were modified to a lower speed than that which is required, the aircraft would potentially be too slow to climb resulting in a tail strike and/or stall.
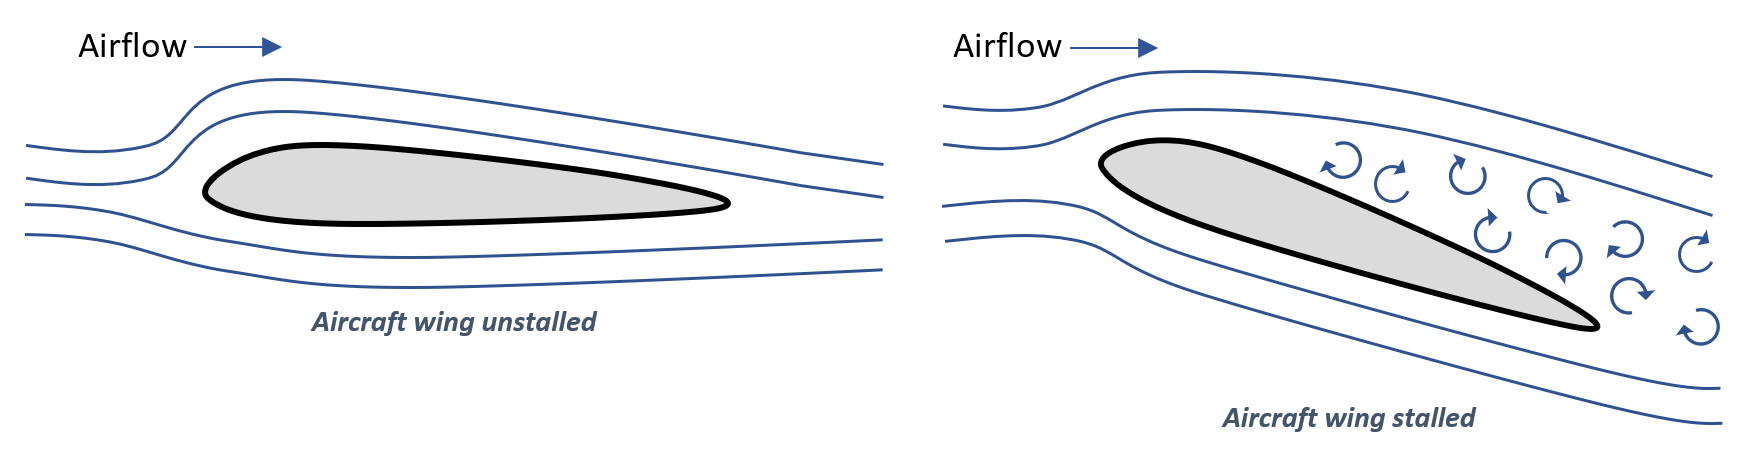
A stall is a loss of lift and an increase in drag which occurs when an aircraft is flown at an angle of attack greater than the angle for maximum lift. It is a law of physics that every aeroplane can be stalled (even the most modern some of which have enhanced protections). Pilots train for this event and the recovery technique involves numerous actions that pilots will perform but the most important is the lowering of the nose to reduce the angle of attack.
Clearly, on take-off and whilst at low level, this is not much of an option as there is little height available to use as part of the recovery. Increasing thrust whilst stalled will generally make things worse as the ability to lower the aircraft nose reduces with increased thrust. In fact in some aircraft part of the recovery from a stall involves removing thrust to help lower the nose. The reality of a stall at low level is that it is unlikely to be recoverable from.
This also continues after departure as most Flap Manoeuvre Speeds use V2 as their reference and are generally calculated based on this alone. As a result, pilots would potentially retract flaps at a slower speed than that which is required if an incorrect V2 was set. This was the cause of the Staines Air Disaster in 1972 (still the deadliest air accident in the United Kingdom) when the pilots of a British European Trident retracted the leading-edge flaps at too slow a speed resulting in the aircraft stalling and the fatalities of all 118 persons on board.
The following photo is a more recent example of using the incorrect speeds for take-off performance (April 2013). The aircraft in question (an AeroMexico Boeing 767) departed from Madrid Barajas airport having used the incorrect V1/Vr/V2 speeds which had been derived from a performance application. The pilots rotated the aircraft at too slow a speed resulting in a tail strike and significant damage to the aircraft.
Image credit: Martin J. Gallego
Full report: https://www.mitma.es/recursos_mfom/ciaiac/informes/2013_010_a_eng_0.pdf
Another recent example is that of a Jet Airways 777 that departed from Amsterdam in 2017. The pilots inadvertently calculated their take-off performance on an EFB using the incorrect take-off weight. The result was deemed attributable to:
“The use of incorrect data for the take-off performance calculation… it was found that an incorrect weight had been entered in the EFB…”
Full report: https://aviation-safety.net/wikibase/wiki.php?id=194950
Incidents/accidents
Royal Air Maroc 737 at FRA in 2016, early rotation/incorrect V speeds for given flap setting resulting in failure to climb:
Report: No investigation was conducted – following link includes discussion of incident: http://avherald.com/h?article=49d159fc
Thomas Cook A330 at MBJ in 2008, incorrect weight entered into Airbus Flight Operations Versatile Environment computerised system resulting in aircraft rotating at too slow a speed:
Thomas Cook 767 at MAN in 2008, incorrect weight used for calculating take-off performance resulting in tailstrike:
See also MK Airlines 747 above in Derate/Flex incidents/accidents
Runway excursion risk. If Vr was modified to a higher value then pilots would rotate late, resulting in increased runway usage which hasn’t been accounted for.
In 2016, an Aerosucre 727 crashed on take-off in Colombia. The investigation found that 380m of extra runway was used – one of the causes of this extra runway use was “the crew incorrectly calculated a take-off speed 5kts higher than necessary”. Whilst other factors increased the take-off run (slight tailwind and poor rotation technique of the aircraft by the pilot), the accident highlights risk of runway excursion and the effect artificially increasing the rotation speed can have on runway distance required.
Report: https://reports.aviation-safety.net/2016/20161220-0_B722_HK-4544.pdf
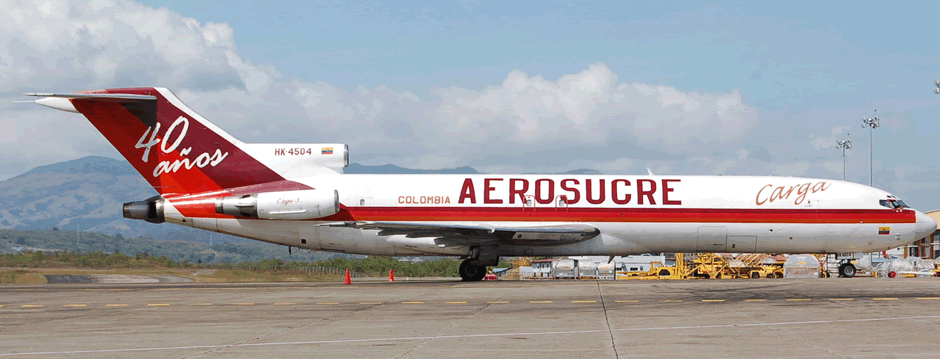
Image credit: Alec Wilson
Artificially reducing the VMCG or preventing its relationship with V1 could also result in a runway excursion as the aircraft would not necessarily have sufficient airflow over the rudder to maintain the centreline of the runway whilst maintaining take-off thrust.
Incidents/accidents
Royal Air Maroc 737 at LGW in 2020, automatic callout of V speeds failed resulting in increased runway use and aircraft becoming airborne 120m from runway end:
Continue reading – part two
What’s next?
There are currently four posts in this series on EFB security:
- EFB Tampering 1. Introduction and Class Differences
- EFB Tampering 2. Device Integrity
- EFB Tampering 3. Take-off part one
- EFB Tampering 3. Take-off part two
Related: EFB Safety Advice for Pilots