
Introduction
I stumbled into infosec the same year the NSA graced us with Ghidra. It’s by far become the most used tool in my arsenal for reverse engineering and vulnerability research. It’s free, extensible, and supports some of the quirkier architectures we come across.
But its learning curve is steep.
This blog post is the culmination of my learnings from spending what may be too many hours in front of Ghidra’s glaring and dated UI. It focuses on firmware analysis, so malware researchers and OS bug hunters may be disappointed, but there should be tips for everyone. All examples are real research projects we’ve undertaken.
It’s worth noting that reverse engineering is not a quick process. It can take weeks to fully understand how a system works. The snail summits Mount Fuji, eventually…
Contents
Identify the load address
Firmware is rarely loaded into memory at address zero. In many architectures the first addresses are reserved for the initial stack pointer and reset vector. The CPU jumps to the reset vector to continue execution. This allows different firmware (e.g., main application code vs. a recovery bootloader) to be loaded.
Without setting the load address, the disassembler will create invalid memory references (to functions, strings, etc.) and lead you to failure.
Base addresses can be determined in several ways:
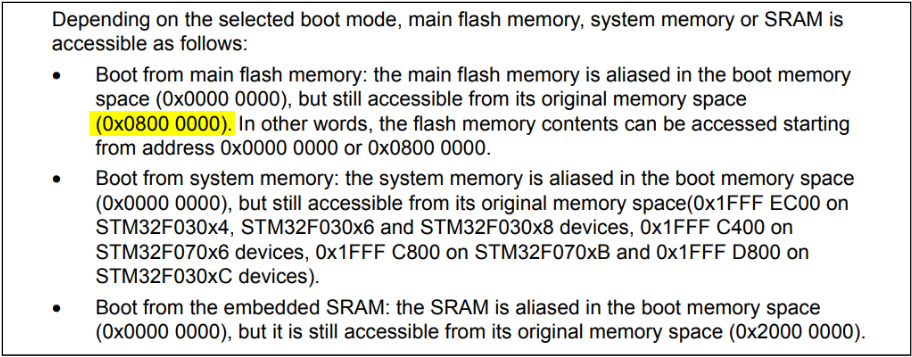
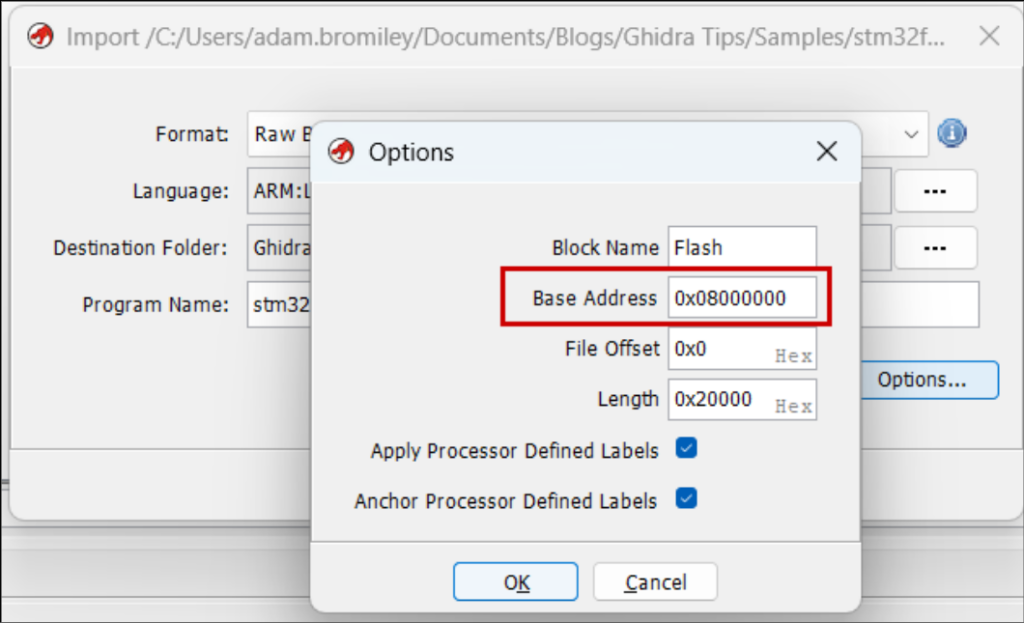
- The chip’s datasheet—e.g., it’s well documented that STM32s load firmware at 0x0800 0000.
- The IVT (see next section)—if interrupt handlers are at 0x20061ae2, 0x2004200c, etc., the base address is probably 0x20000000.
- String references—get the offset of strings and look for potential pointers to them in the code. For a string at offset 0x5eea4, search for references to 0x5eea4 (endianness considered). Repeat with another string, then another. If all the strings have potential references with the same significant bytes (e.g., 0x1005eea4, 0x10014a2, …), you’ve identified the base address. You’ll get false positives performing this manually, but tools can be used to sample hundreds of strings at once and check what base address creates the most valid references.
- Other known firmware structures—binbloom identifies UDS databases in automotive firmware that contain pointers to handler functions. Like the IVT method, it determines the base address from the MSB of each function pointer. Your firmware may also have debug tables that map function names to addresses.
Find the interrupt vector table
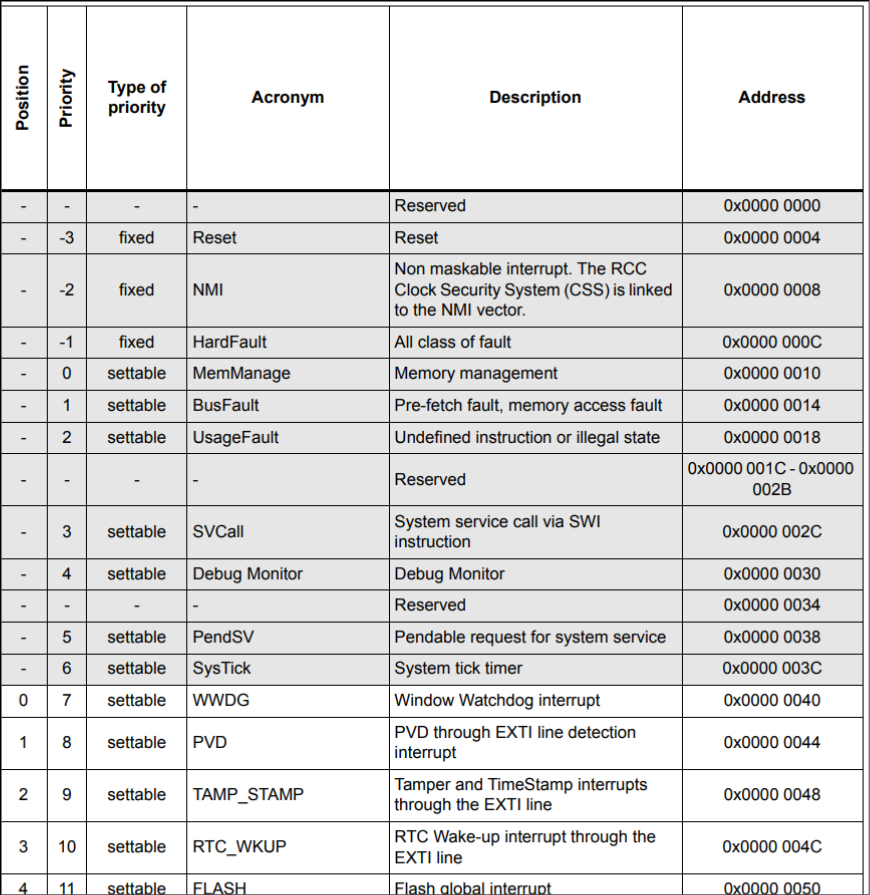
Often starting at offset zero, the IVT is a table of addresses for interrupt handlers.
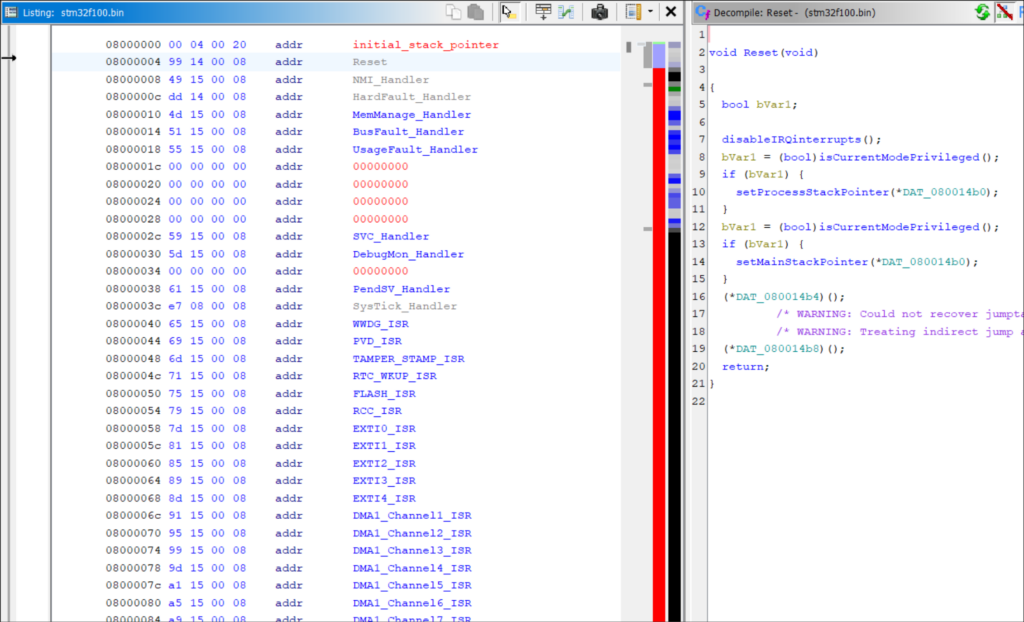
Set each entry’s datatype to a pointer (key binding “p”) and you can double-click to jump to the handler’s code. Kick off disassembly with key binding “d”.
The table’s first record is typically the reset handler (or the second, if the first is an initial stack pointer). This is the firmware’s entry point. Disassembling the reset handler is a helpful precursor to running Auto Analysis, since it will run through most functions in the correct order of execution.
The purpose and location of each IVT entry is documented in your chip’s datasheet.
Define a memory map
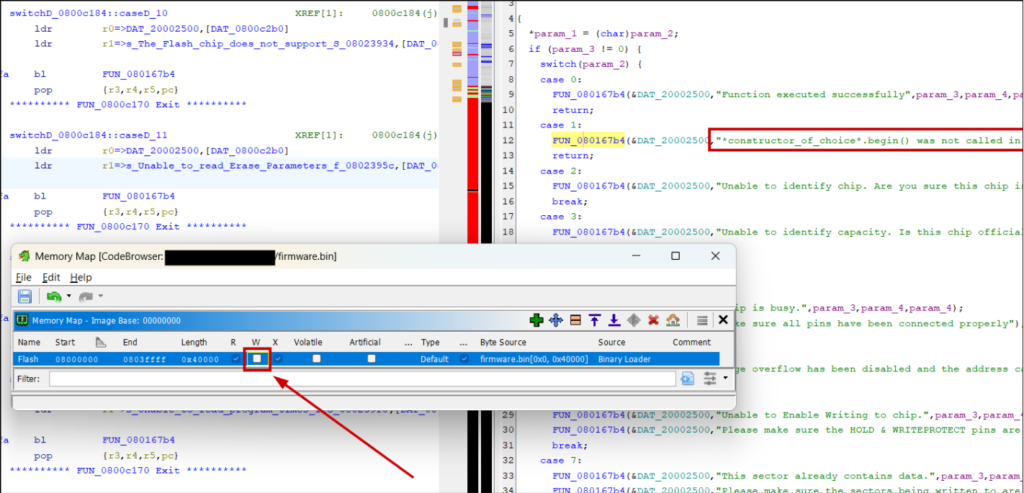
Flash memory will already be here with the base address of what you set previously. What Ghidra doesn’t do is set it as read-only (it’s expected that firmware usually does not or cannot write to the loaded flash image).
Strings and other read-only data structures will have odd references:
Set to read-only and they’ll appear as expected:
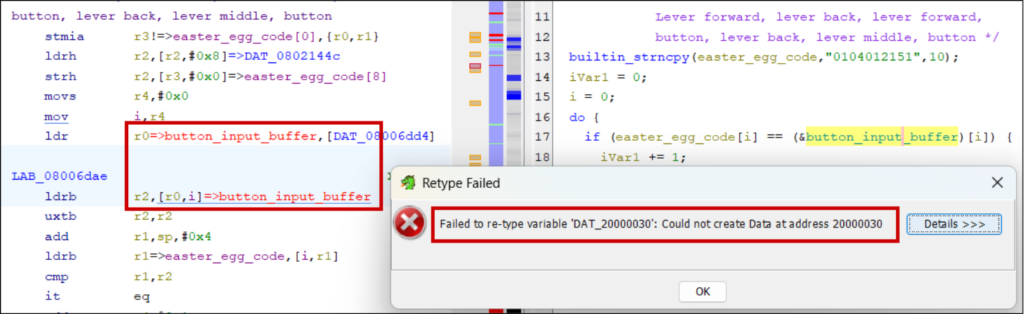
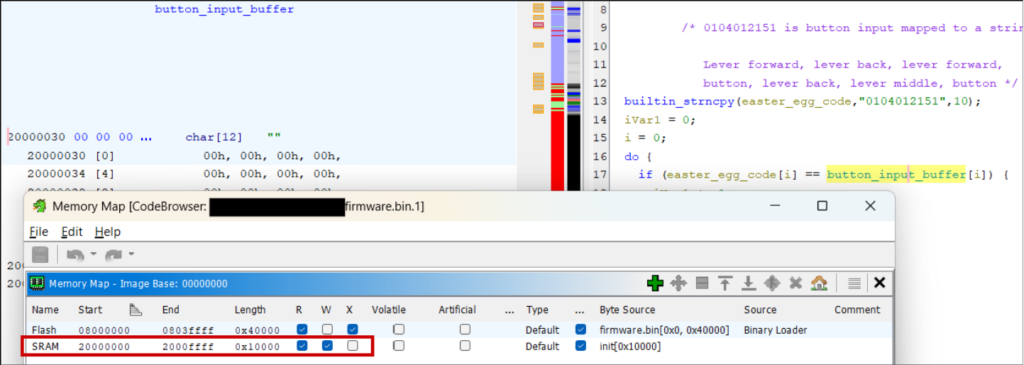
It’s also worth defining read-write SRAM (using addresses in the chip’s reference manual), otherwise addresses will show red and you cannot define their datatype or initialise them with data:
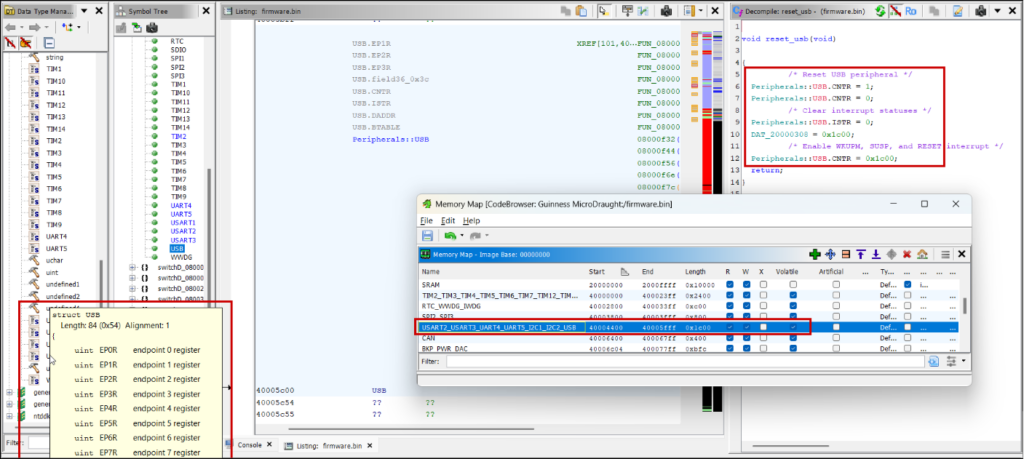
The final task is adding the location of registers so you know what peripheral a subroutine is interacting with, otherwise you just see references to an unknown address.
CMSIS System View Description (SVD) files list these locations for ARM microcontrollers and can be loaded into Ghidra with the SVD-Loader script (https://github.com/leveldown-security/SVD-Loader-Ghidra). The script also sets the peripheral registers’ datatypes to well-defined structs:
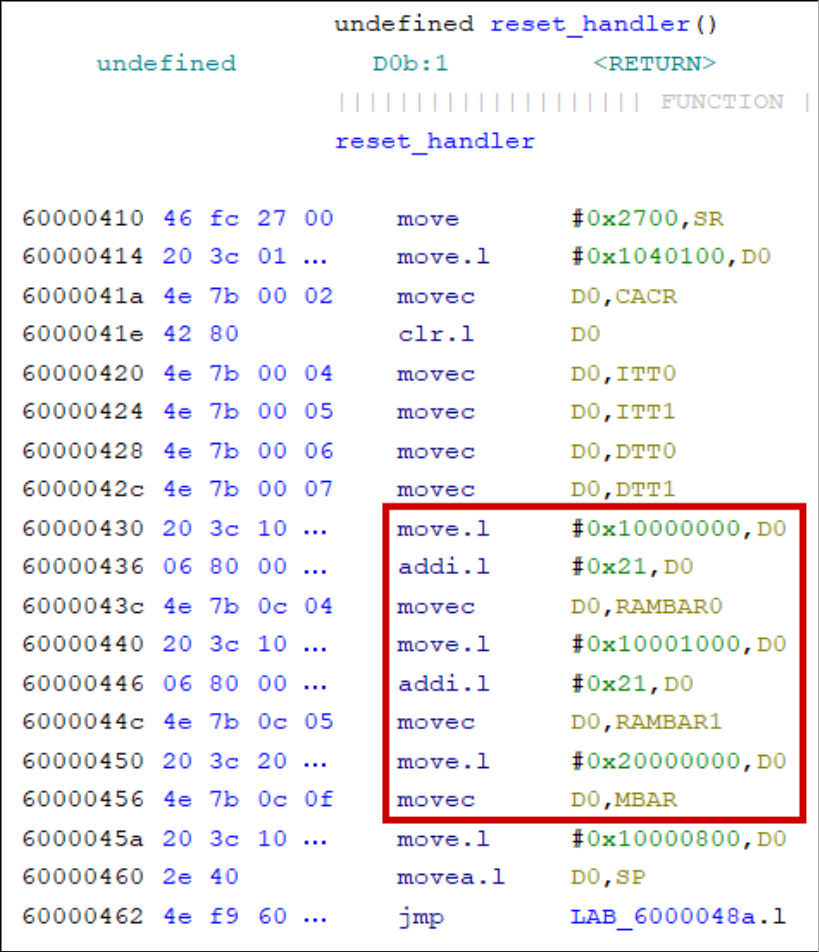
M68000 processors have peripheral locations that depend on runtime-configured base address registers (VBR, RAMBAR, and MBAR). Look in the firmware’s initialisation sequence for how these are set:
Annotate as much as possible
Even if a function or data address seems irrelevant, if you have an inkling of its purpose, label it with key binding “l”. It helps down the line when you see it referenced elsewhere. For binaries with symbols, prefix your labels to distinguish them from autogenerated ones.
Add comments (key binding “;”).
Labelling variables and correcting their datatypes (“Ctrl-l”) helps understand the decompilation, especially when returning to the project after a long weekend. You’ll reach the point where you reconstruct subroutines into compilable C snippets.
Identify functions with strings
This is an obvious one. Since firmware is often stripped of symbols, strings are the only form of documentation the vendor provides you.
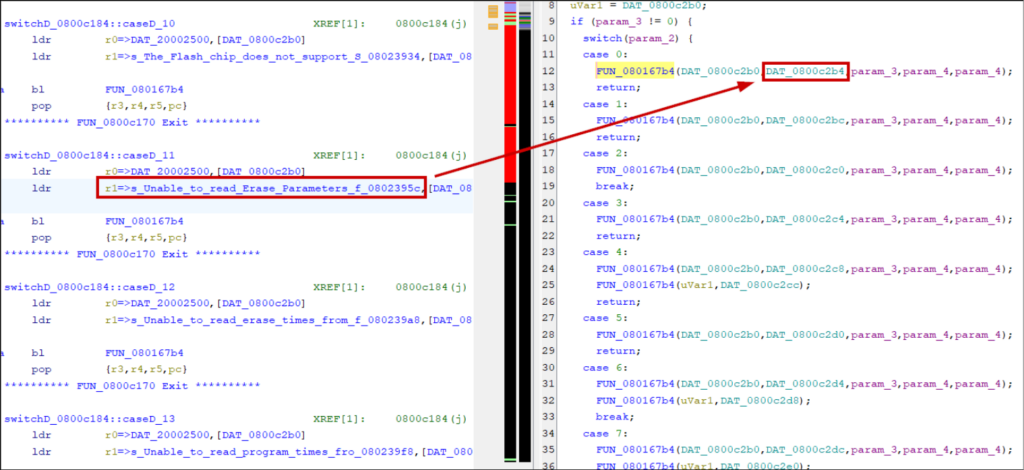
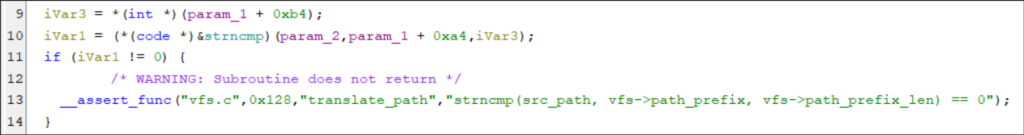
Debug logs, assertion, and exception messages often provide a full function prototype that allows you to rename the function and set correct parameter datatypes:
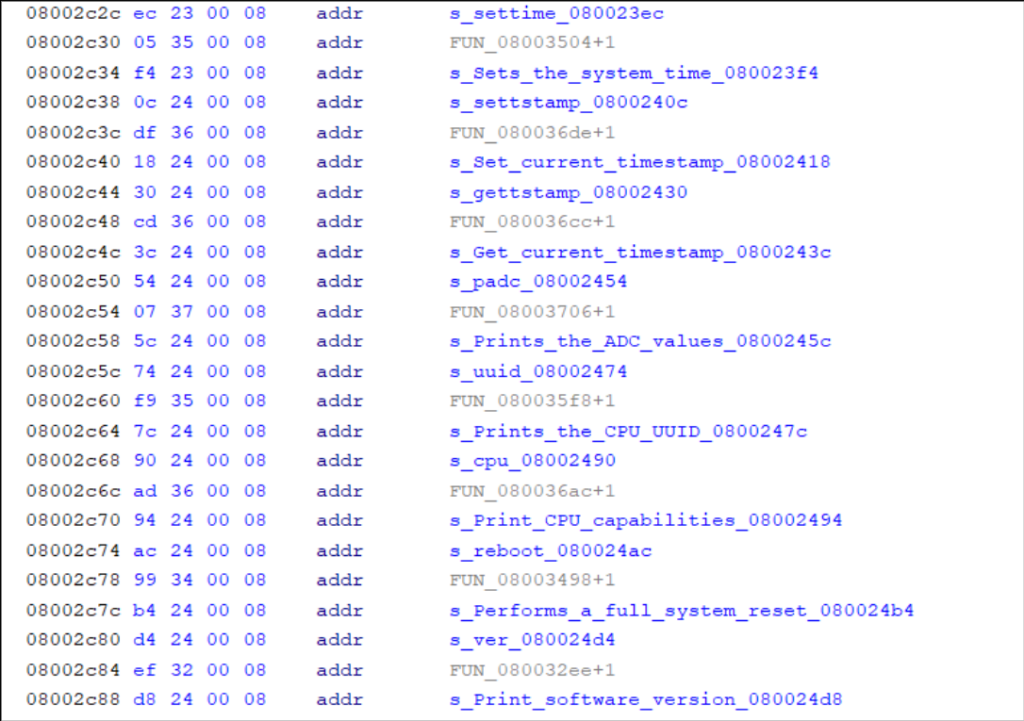
Address tables sometimes have titles or include function names alongside their pointer. Find these automatically, with other cross-references, bookmarks, or by manually scrolling through the disassembly:
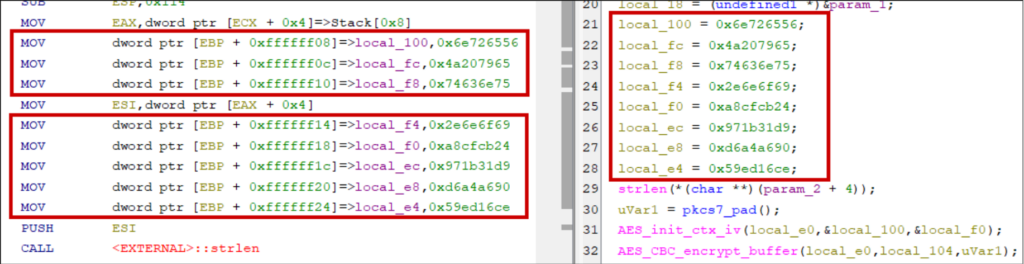
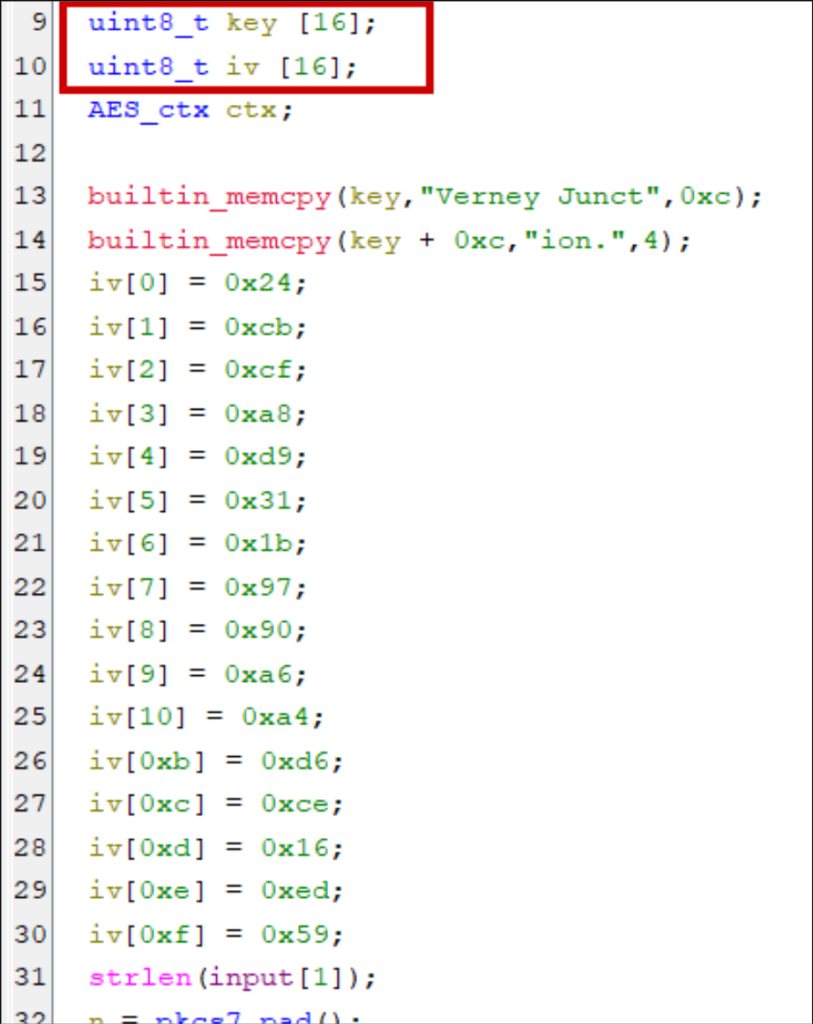
Don’t miss stack strings
Strings can be constructed on the stack instead of being stored at compile time in static data sections. Why? Optimisation (e.g., four-byte strings can be handled in 32-bit registers), obfuscation, or intentional design choices concerning memory allocations, lifetimes, and real-time constraints.
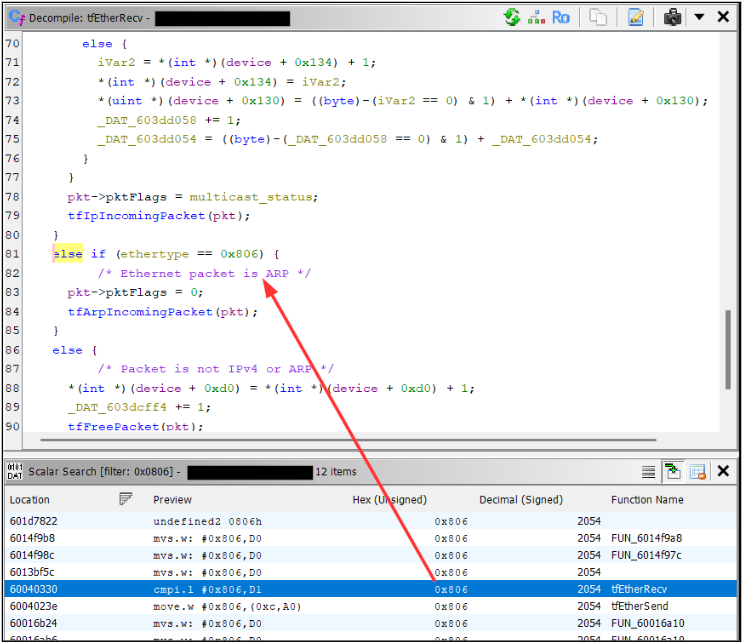
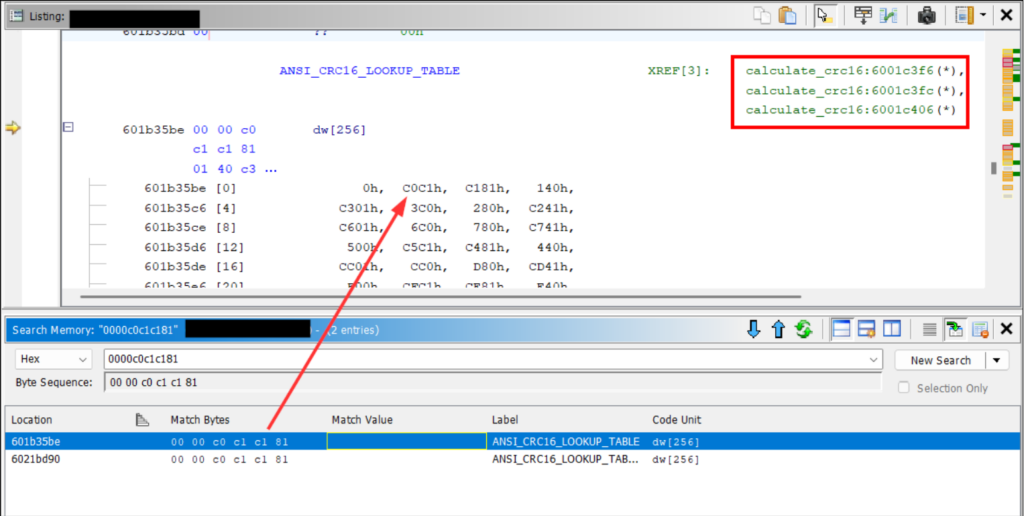
Hunt for magic values
A less obvious method of function identification. Use the memory and scalar searches for known constants like the DHCP magic cookie (0x63825363), ARP’s EtherType (0x0806), or the AES S-Box.
RTOS scheduling
Real-time operating systems add a layer of complexity to reverse engineering. Global resources are shared between subroutines, it’s more common to see heap allocations and objects passed by reference, and it’s challenging to separate kernel code from application code.
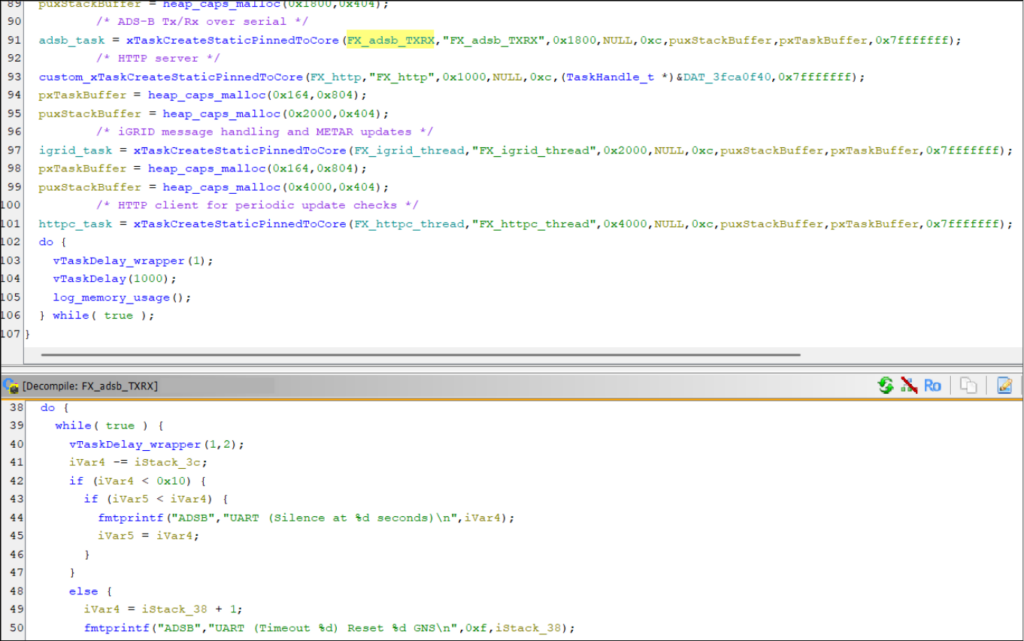
It’s helpful to identify how tasks are invoked. The task creation routine will take a pointer to the function that implements the given task. By searching for calls to this routine, you’ll get a list of all function pointers to application code.
Task creations also often take task names as arguments for debug purposes. So in addition to getting useful function pointers, you can label them with descriptive names. FreeRTOS defines xTaskCreate with the following:
BaseType_t xTaskCreate(
    TaskFunction_t pvTaskCode,    // Pointer to the task's entry function
    const char * const pcName,    // The task's name
    const configSTACK_DEPTH_TYPE uxStackDepth, // Words to allocate for the stack
    void *pvParameters,           // Arguments for the task
    UBaseType_t uxPriority,       // Scheduling priority
    TaskHandle_t *pxCreatedTask   // Handle to the created task
);
There’s often a dedicated task per network service so this knowledge is critical if you want to, say, focus your efforts on reverse engineering a custom protocol.
BSim to identify library functions
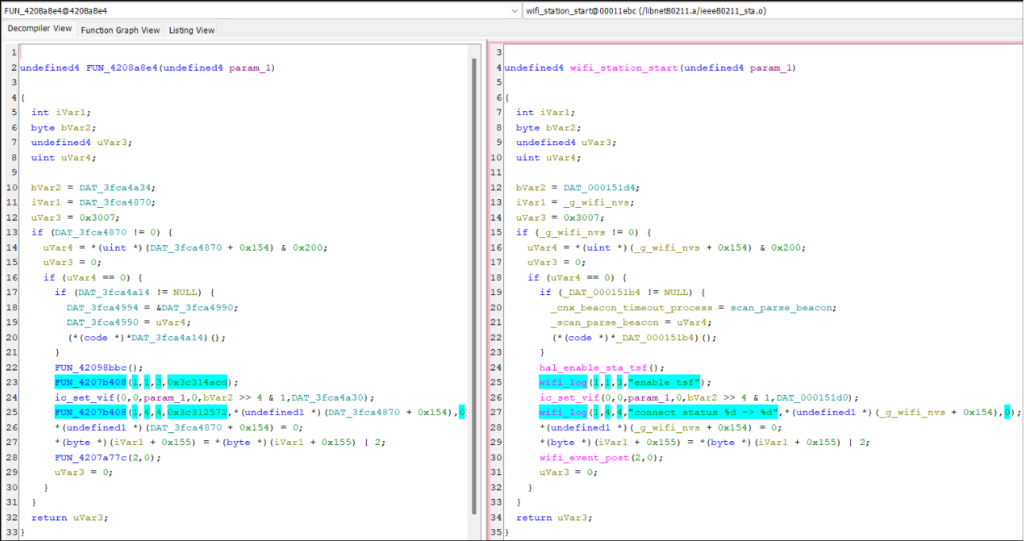
Ghidra BSim is a plugin for fuzzy-matching code with a database of known functions.
By knowing certain libraries used by the firmware (e.g., the RTOS or TCP/IP stack), you compile those libraries (or use public precompiled releases) yourself with debug strings. Feed them into Ghidra and it creates a database containing signatures of all the library functions.
You then compare functions in your firmware with the BSim database. Unlike function IDs, it performs fuzzy matching. It manages to match a large proportion of functions even if the library is a different version or was built with a different compiler for a different architecture. With two clicks you can copy the function name and any custom datatypes.
We published a full tutorial here: https://www.pentestpartners.com/security-blog/fuzzy-matching-with-ghidra-bsim-a-guide/
Source code importing
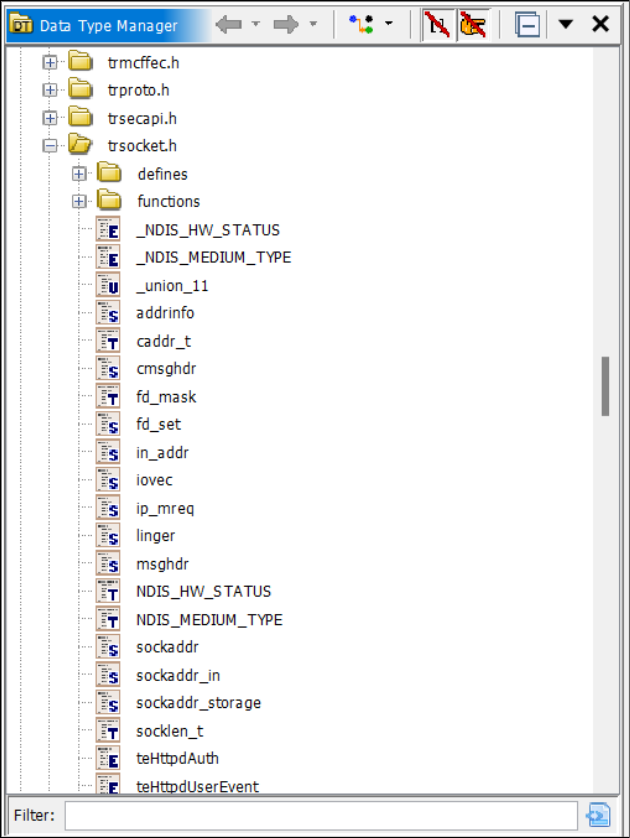
Try importing header files for libraries you know the firmware uses. Ghidra will populate the Data Type Manager with all typedefs, structs, and function prototypes. Preprocessor constants can annotate the decompilation with Set Equate… (key binding “e”).
This can be finicky to get working. Ghidra’s source code parser isn’t intelligent and the order of imports matters. You also need to set the correct preprocessor constants to pass #ifdef conditionals and add C standard library headers to the include path if relied on by the library (a complete C environment is not necessary; minimal sets of standard header files exist).
Bookmarks
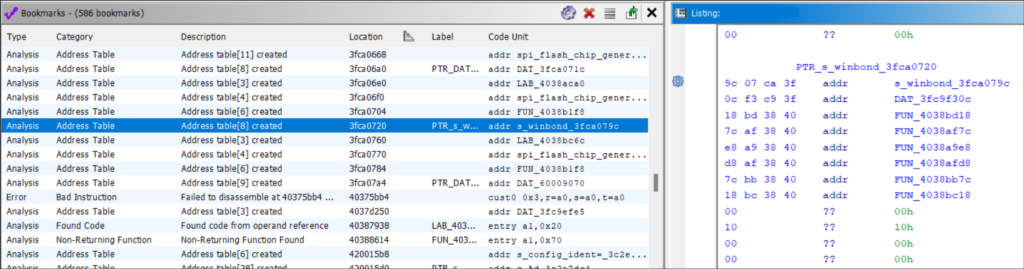
Ghidra populates the bookmark table during auto-analysis.
Here you can find address tables (useful for function identification), “undefined” functions (found from known operand sequences instead of references), embedded media, and places where disassembly failed.
Bookmarks can also be manually set or set by plugins.
Delve into the assembly
Unless you’re narrowing down on a vulnerability or exploring an archaic system that uses handwritten assembly or eccentric compilation techniques, the bulk of reverse engineering work will be in the decompilation window.
It makes logic flows easier to follow and allows you to annotate code with datatypes and descriptive names.
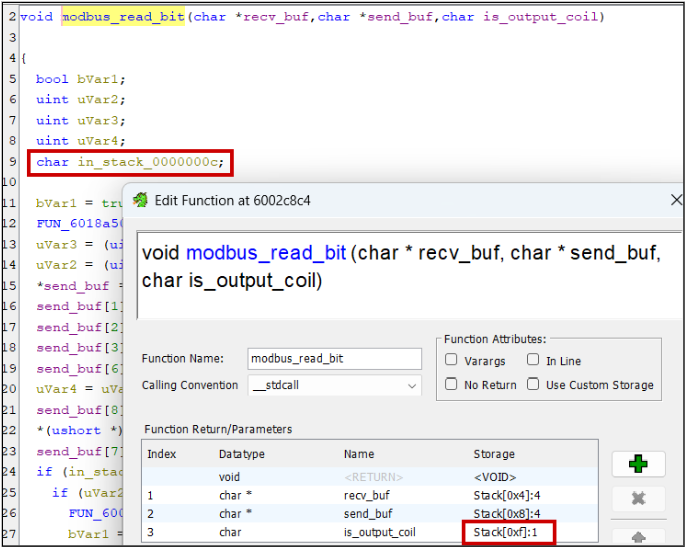
But the translation to pseudo-C isn’t always perfect. Ghidra often incorrectly assumes the number of function parameters or the size of variables. Sometimes, it can’t decompile the code at all.
Warning signs can include the existence of “in_”, “in_stack_”, “unaff_”, and “extraout_” variables in the decompiler view.
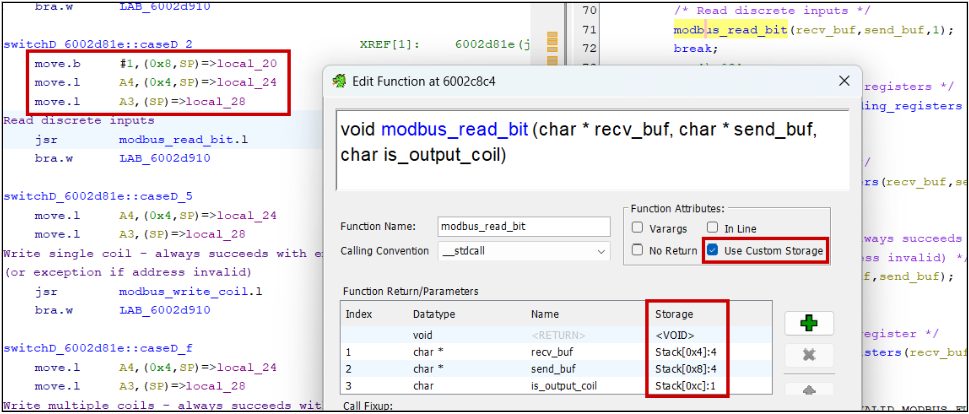
Reading the assembly is crucial in these scenarios. Research the calling convention used by your architecture, if parameters are passed on the stack or in registers, what order they’re read, and what registers can be clobbered by functions.
Without debug symbols, Ghidra fails to identify variadic and thiscall functions, e.g., printf(char *fmt, …) and object::method(). Set these manually in the Edit Function Signature window.
Make the most of scripts and plugins
I’ve already mentioned SVD-Loader but there are plenty of other scripts to automate processes or annotate interesting functionality.
As examples: I’ve used the VxWorks Symbol Table Finder with success, Leaf Blower to find format strings and string.h functions, FindCrypt, and Stack String Explorer.
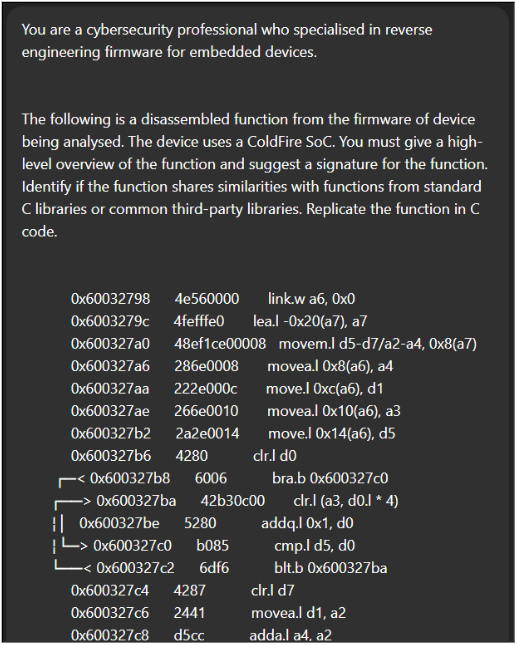
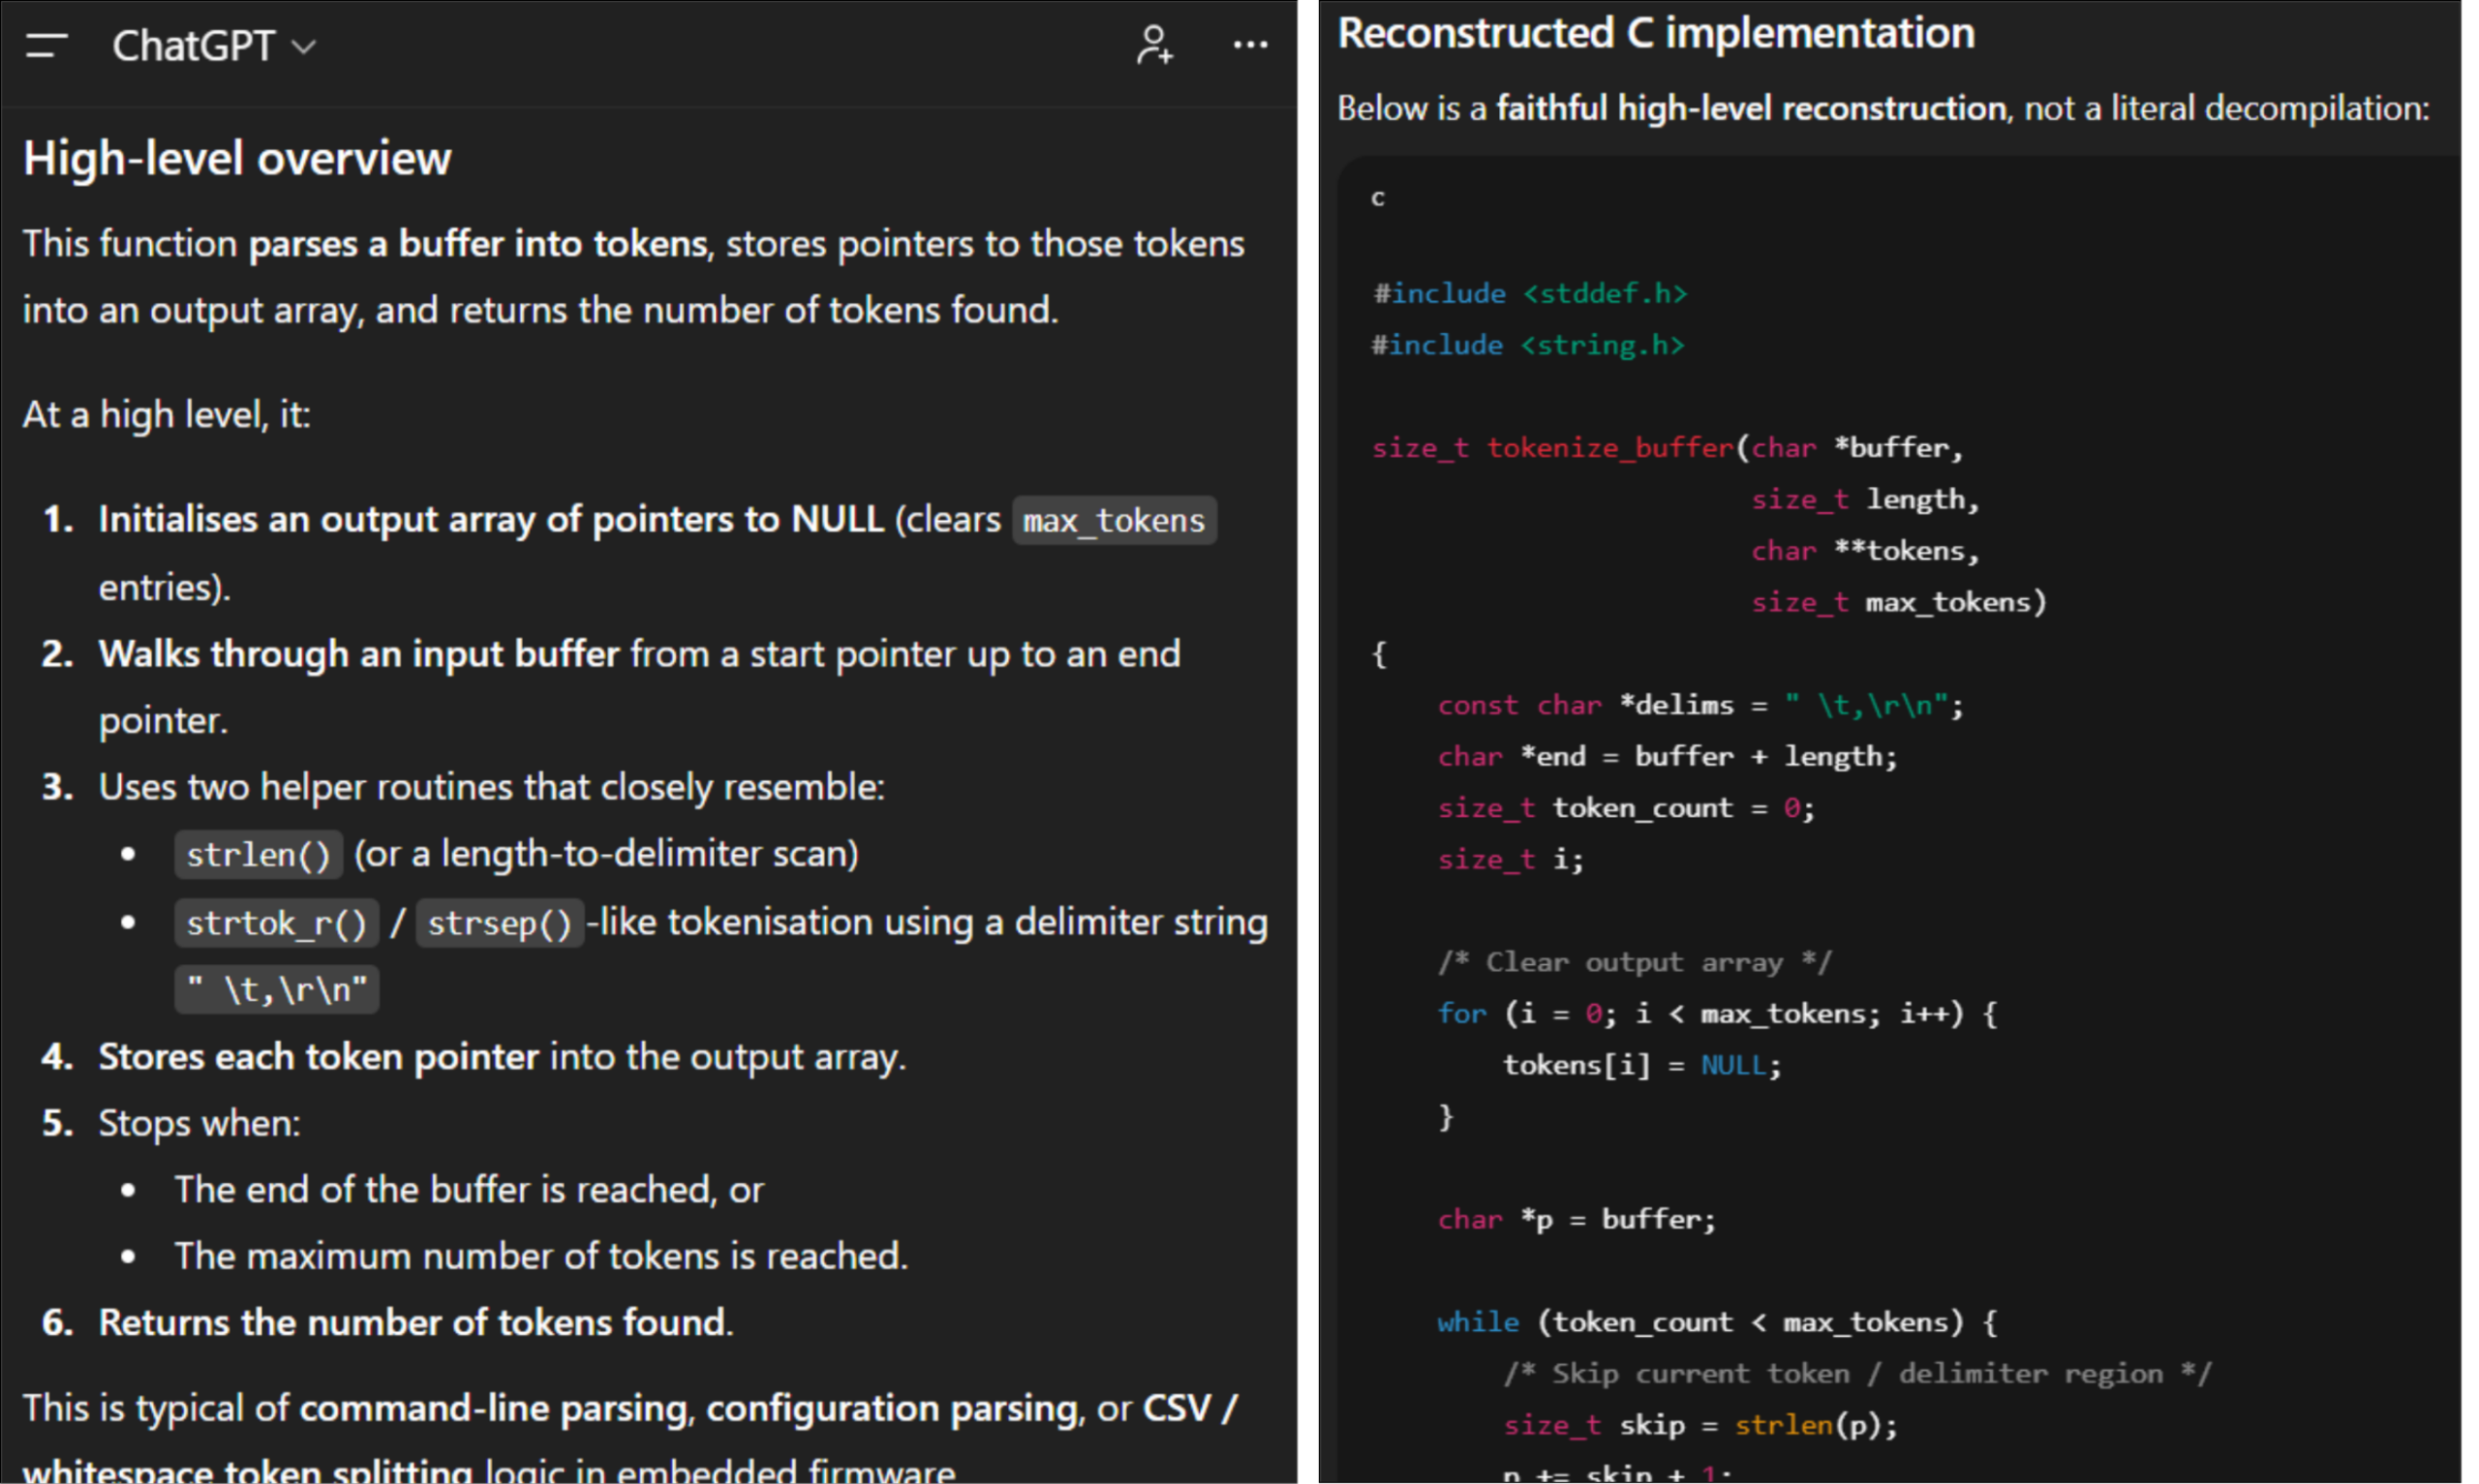
Large language models
I often feed Ghidra disassembly and decompilations into LLMs. It’s great for quickly identifying common algorithms like memory allocation, checksums, and cryptographic routines. At its simplest, naively copy-pasting Ghidra output into a chatbot like ChatGPT with a simple prompt will provide good insights.
We’ve also found success with dedicated AI extensions.
GhidrAssist (https://github.com/jtang613/GhidrAssist/) supports a variety of LLM APIs and provides a chat window with a solid default prompt template. You can provide supporting context with handwritten text documents or reference manuals, and it can be instructed to autonomously perform investigation loops for analysing more complex logic with self-reflection.
It also supports Model Context Protocol (MCP) servers to enhance the output with automatic decompilation and symbol annotation. The same author made GhidrAssistMCP for this purpose, but we’ve also used LaurieWired’s GhidraMCP with success (https://github.com/LaurieWired/GhidraMCP).
As is always the guidance for AI: it hallucinates so verify output, and use a local instance or one with enterprise data protection for commercially sensitive code.
Conclusion
Like any tool, the more you use Ghidra, the better you get. Now go reverse engineer some firmware!